IT Infrastructure
Graph Visualization of a Configuration Management DBIT infrastructure demo is based on an anonymized dataset of a Configuration Management Database (CMDB) which is in heart of every IT infrastructure management framework (e.g. ITIL or other). CMDB typically holds information about every entity of an IT network and most importantly information about relationships between these entities. The power of Graphlytic is in general network visualization capabilities where all relationships together can provide a comprehensive picture of the infrastructure.
Graphlytic is a link visualization and analytics tool and it can be used with any type of infrastructure, whether you want to create an AWS infrastructure visualization, custom cloud infrastructure visualization, or a network visualization in general.
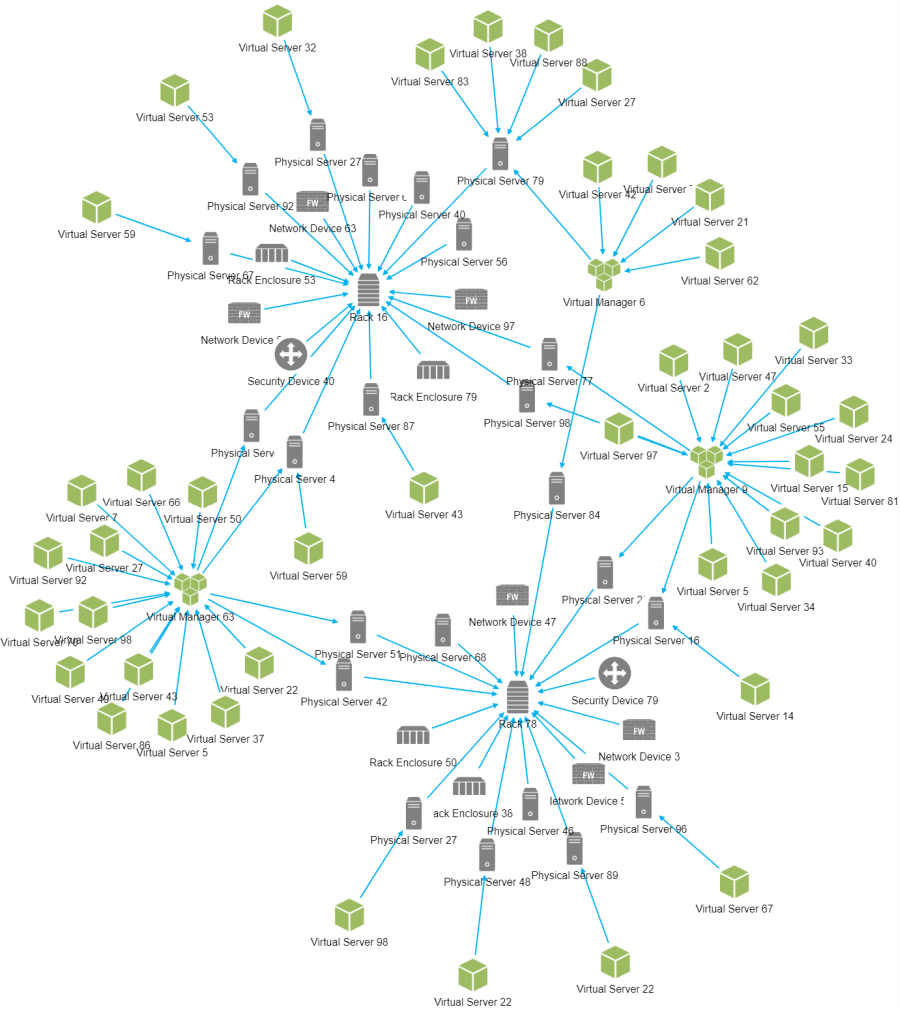
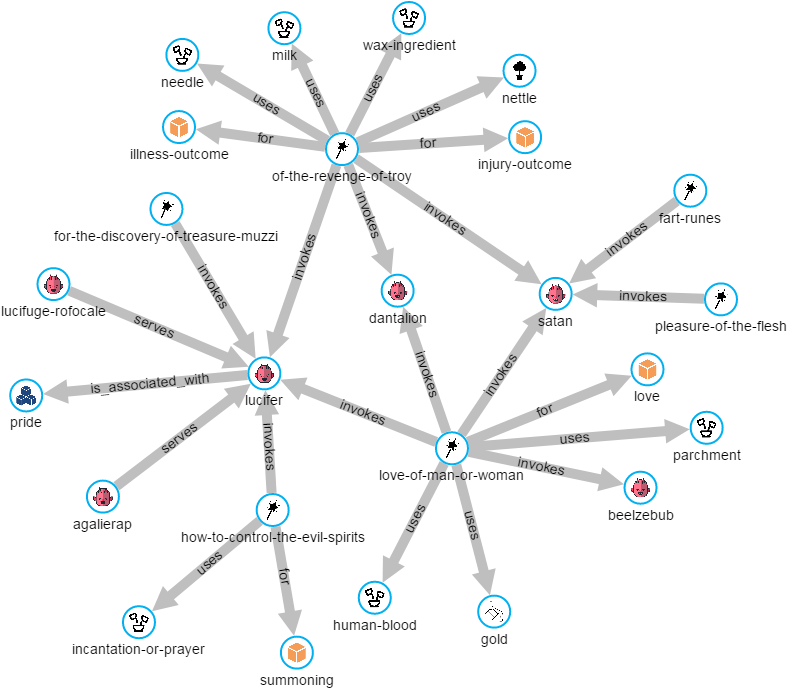
The example in the picture below shows one of the virtualization clusters in the CMDB database. The cluster's HW is spread across two
![]() Racks and multiple
Racks and multiple
![]() Physical Servers.
Physical Servers.
![]() Virtual Managers (e.g. VMware) installed on these servers are then splitting the HW resources into multiple
Virtual Managers (e.g. VMware) installed on these servers are then splitting the HW resources into multiple
![]() Virtual Servers which then hosts applications or databases (not pictured).
Virtual Servers which then hosts applications or databases (not pictured).
Other graph visualizations in the demo
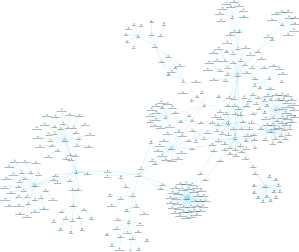
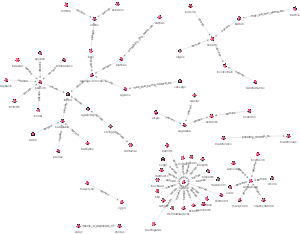
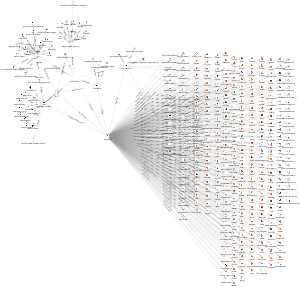
Cluster Visualization
A larger cluster of nodes showing how multiple services can share the same hardware resources.
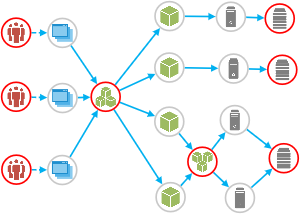
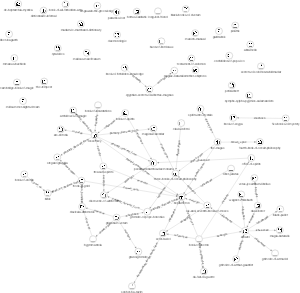
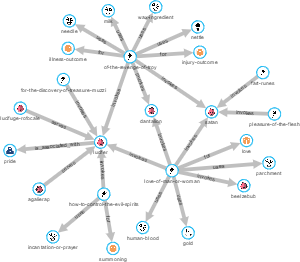
Compact View
View of a specific cluster showing entity relationships in detail.
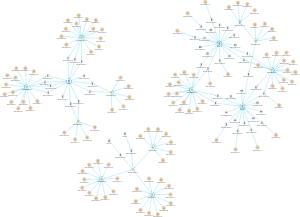
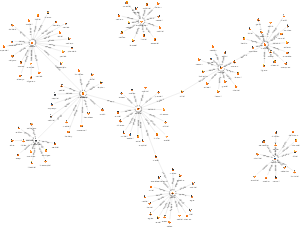
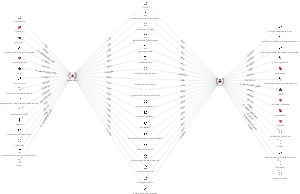
Top 3 HW Platforms
Shows the three largest HW platforms in the database. From racks to virtual servers and network devices in one picture.
What can you try in the demo?
- Search for patterns and save your search queries or shate them with users in the project
- Create a graph visualization with some nodes and explore their relationships - double click on a node to read all relations of that node from DB and add them to the graph visualization
- Save created graph visualization to your visualizations in the project
- Statistics: play with property histograms in graph visualization - select element categories
- Virtual properties: create virtual properties (custom formulas) on nodes and relationships with JavaScript
- Find the shortest path: select 2 nodes (Shift+Click) and press the "Find shortest path" button in the top toolbox to calculate the shortest path (calculation is done in DB and new elements are added to the graph visualization if needed)
- Graph visualization styling: create styling mappers in the "Settings" tab to style the graph visualization according to data to highlight patterns
- Layout: use one of the layouts in the toolbox to automatically rearrange the graph visualization (layout is applied only to the selected part of the graph visualization or to all elements if nothing is selected)
- Image and data export: use one of the export options in the "Export" dropdown menu or export CSV data or image of the graph visualization