Projects
Table of Contents
Projects are the main building blocks of Graphlytic. Every project has a name and uses one graph connection to connect to a graph database. This graph is then used in all queries and visualizations in the context of the project.
The Projects page is available in the Main menu (top right).
This page shows all projects and allows you to create new projects or manage existing ones.
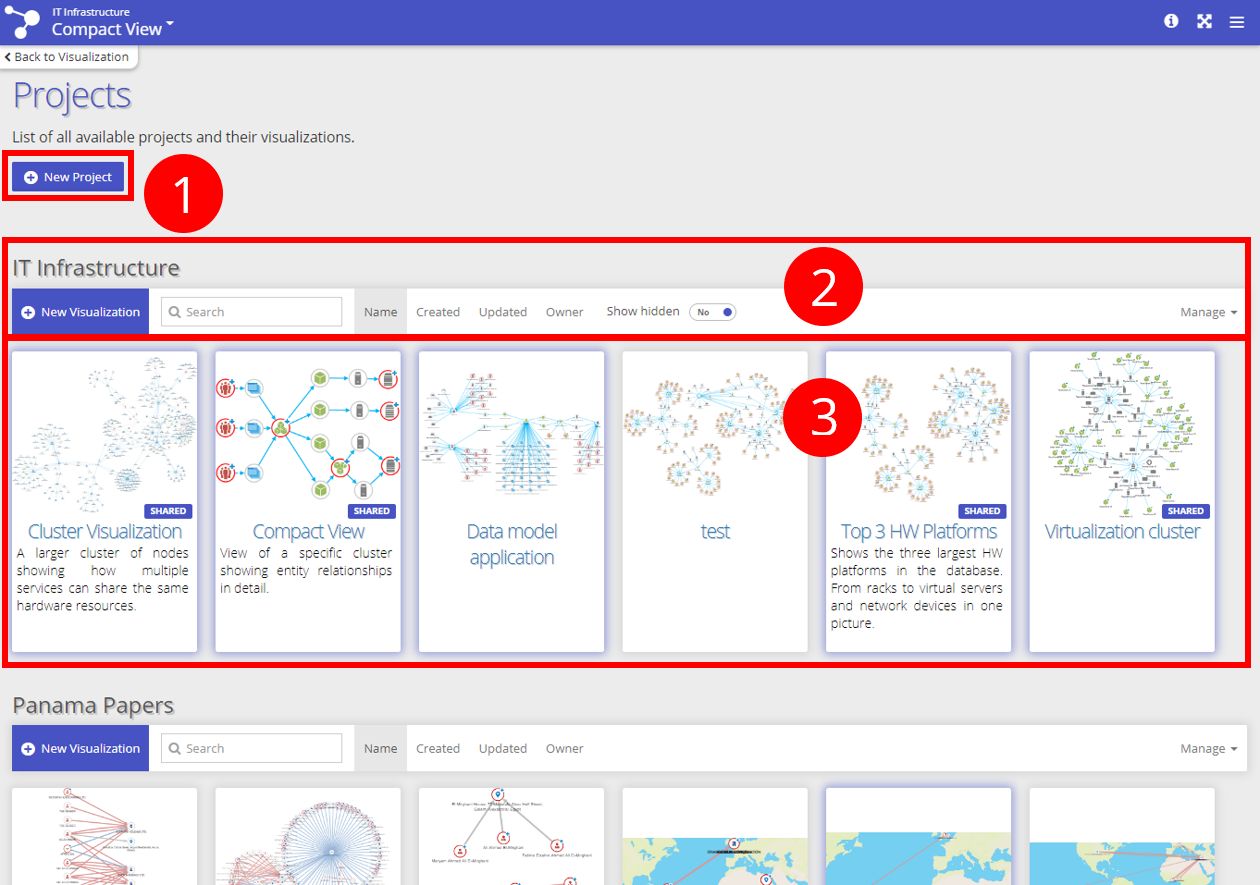
1. New Project
A new project can be created using this button. Only users with Project Settings permission can create and manage projects.
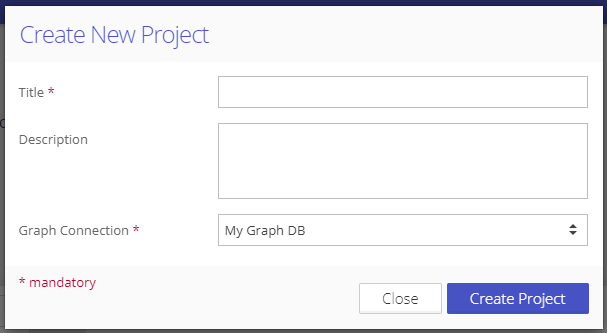
After clicking on the button a modal window is shown. Fill in the name, and description (optional), and choose a graph connection for this project:
2. Actions panel
Every project has its own panel with different actions:
The button "New visualization" will open a new blank visualization.
Search field - filter down the list of visualizations using a fulltext search in names and descriptions of the visualizations.
Sorting buttons "Name", "Created", "Updated" and "Owner" can be used to order saved visualizations by any of these properties.
Switch "Show hidden" to show or hide the hidden shared visualizations (see List of visualizations for more information).
Menu "Manage" - this menu is visible only for users with the "Project Settings" permission and contains project management features like renaming the project, changing the graph connection, deleting the project, and accessing the Project Settings page.
3. List of visualizations
This list shows all the visualizations created by the logged-in user and the visualizations shared by other users. Move the cursor over the visualization to see additional information, like the owner, created, and updated dates, the ID of the visualization, etc.
A user with permission to "View all visualizations of all other users" sees all existing visualizations.
To open a visualization click on the image or name of the visualization. There are several options for how the data for visualization can be loaded. See "Loading modes" below for more information.
If the visualization was created by the logged-in user (is not shared with the user by some other user) there are these operations available:
Share: see "Share visualization" below
Update: name, description, and loading mode (see below for more info about Loading Modes) can be changed
Delete: visualization is removed
If the visualization was not created by the logged-in user:
Hide: shared visualization can be flagged as hidden. You can later see hidden visualizations with the "Show hidden" switch in the Control Panel.
3.1.1. Share visualization
Visualization can be shared:
In-Application - Inside the application for authenticated users only.
Publicly - for unauthenticated users.
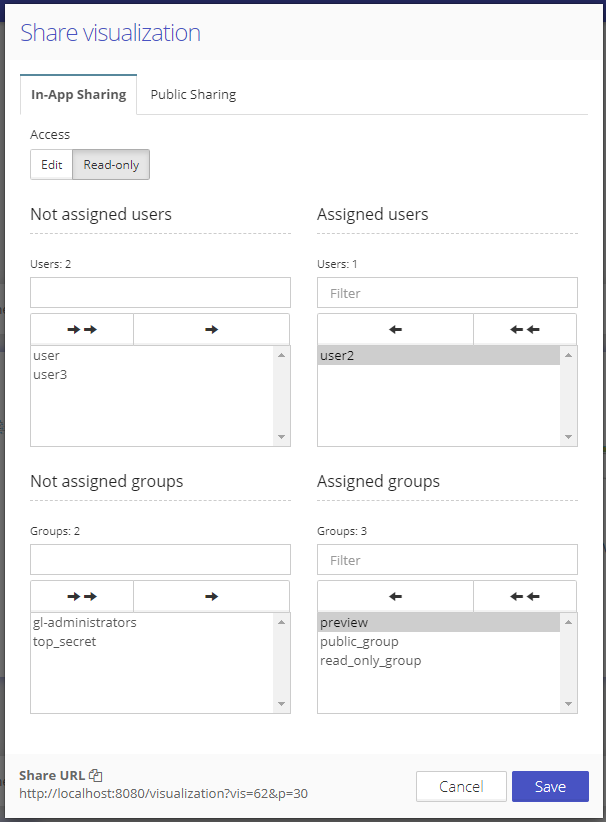
3.1.1.1. In-app Sharing
If the user has permission to "Share visualizations", visualizations can be shared with other users, or groups of users. The user can share a visualization with groups that he is a member of or with users who are members of these groups.
If the user has permission to "Share visualization to everyone", visualizations can be shared with any group and any user in the Graphlytic application.
Access levels - visualization shared in the application can have these access levels set:
Edit - allows all users to change the visualization and save the changes (these changes will be visible to all users that have access to this visualization).
Read-only - only the owner (creator) of this visualization can make changes to the visualization. Other users can only view the visualization, but can’t save any changes (they can use Save As to clone the visualization into their workspace).
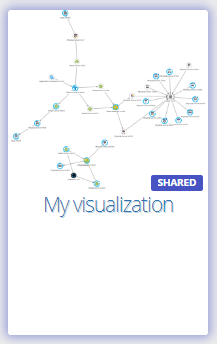
When visualization is shared with other users or groups in the application a shared label is shown on the visualization tile:
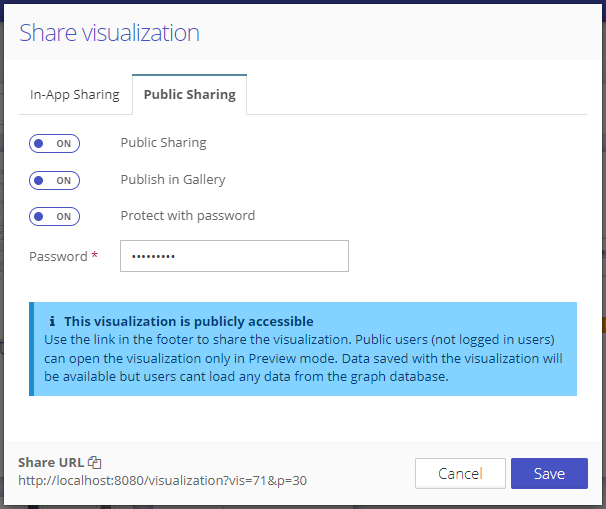
3.1.1.2. Public Sharing
Public sharing gives access to a saved visualization to unauthenticated users (users without login access). Such access is strictly limited, only data saved with the visualization can be viewed. There is no way to access any data in the graph database (other than the data saved in the visualization) or perform any type of query in the graph database.
Public sharing options:
Publish in Gallery - when turned on the visualization is listed in the Dashboard on the Login page.
Protect with password - when a password is defined this password has to be entered with every visualization access by an unauthenticated user.
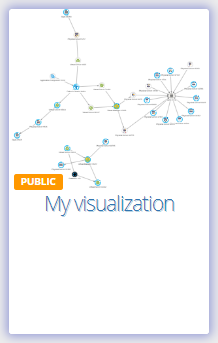
When visualization is shared publicly a public label is shown on the visualization tile:
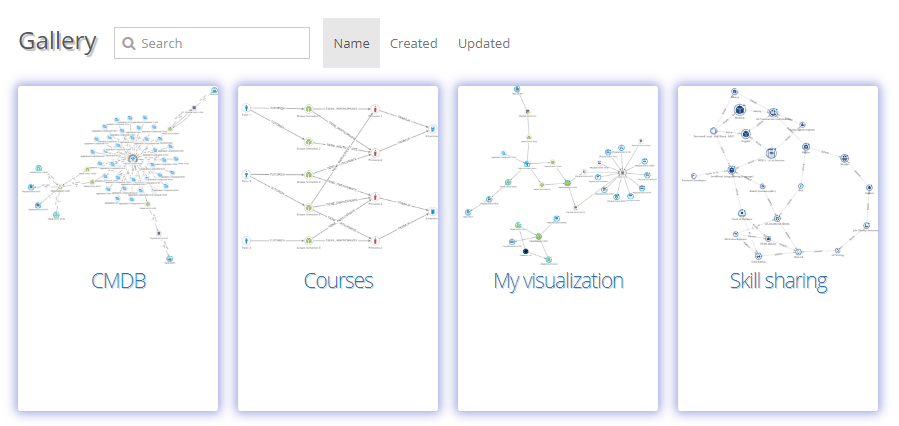
All publicly available visualizations that have the “Publish in Gallery” option turned on are listed on the Login page:
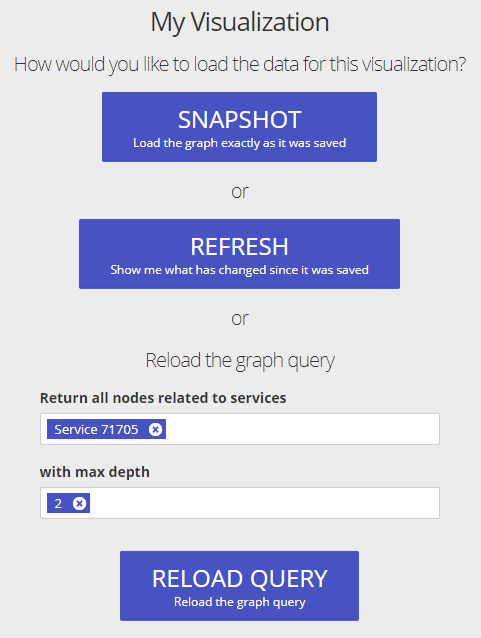
3.1.2. Loading modes
When visualization is being opened, these situations can happen (based on how the visualization is configured):
SNAPSHOT - The saved graph is loaded and visualized exactly as it was saved
REFRESH - The graph is loaded and every node and relationship is checked against the graph database for any changes. If some changes are detected then the refreshed data is used and changed elements are highlighted.
QUERY - If the visualization was created using a query (Cypher, Gremlin, or Query Template) then there's also an option to automatically reload the query on visualization loading.
If the loading should happen automatically, or if the user should choose from one of the options above, can be configured in the visualization in the Settings tab of the Control Panel.
Example of the loading options during visualization loading: