Widgets
Required Permission: Project Settings management (Read more about permissions in User Groups)
Table of Contents
Widgets are extensions of the visualization UI written in JavaScript, HTML, and CSS. To add new widgets to the application please refer to Widgets Management .
When a widget is added to the project this widget is used in all visualizations (saved, or newly created) of this project.
1. Add Widgets to Project
Open the Project Settings page.
Chose the Project where you want to add widgets.
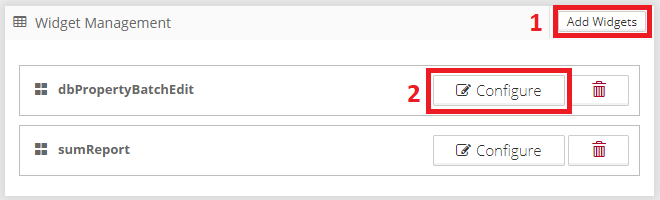
Click on the “Add Widgets” button (1) in the header of the “Widget Management” panel.
Chose widgets that should be added to the project and click “Add”.
Configure the widget (2). Configuration is a JSON data structure providing additional context for the widget initialization.
Configuration is an optional step and not all widgets require configuration. Please refer to the documentation of the added widget to properly configure it.
2. Internal Widgets
There are several internal widgets included in Graphlytic installation which you can use out of the box. See below for a full list of internal widgets and their configuration options.
2.1. Sum Report Widget
Demo of a widget that uses selected nodes in the visualization to calculate a summary of one property across these nodes and the result is presented to the user in the form of a table in a modal window.
Example of configuration:
{ "valueProp":"costs"}Config attributes:
Attribute | Description |
|---|---|
valueProp |
|
2.2. Outage Propagation Widget
This widget adds the "outage propagation button" to the Tools panel in Visualization for simulating outage propagation in the graph.
Usage: select one or more nodes that are outage starting points and click the outage propagation button. The widget calculates (based on starting points and configuration option) the nodes and relationships which propagates outage in this step and selects them. You can press the outage propagation button multiple times and in every step, the same calculation is made so you can observe the outage propagation effect in the graph.
Example of configuration:
{ "outageProp":"outageDependency", "outageValue":"yes", "thresholdProp":"outageThreshold"}Config attributes:
Attribute | Description |
|---|---|
thresholdProp | Name of relationship DB property with outage values. |
outageValue | Value of outageProp which will be considered as true. In case of this value the relationship is considered to be a outage propagator. |
outageProp | Name of relationship DB property with threshold value. Threshold is a numeric value representing minimum number of nodes outgoing relationships with active outage in order to consider the node to be down (to be affected by this outage). In case multiple outgoing relationships of a node have different thresholdProp values then the minimal value is used. If not defined then the outage is calculated as if threshold value is 1 (always propagate to node). |
3. Widgets Setting Export/Import
The Widgets setting is a collection of widget configuration objects of all widgets in the project. The setting file can be exported and imported on the Project Settings page, which is useful for backup and migration purposes.
For more information please refer to Project Settings .
3.1. Description of WIDGETS configuration
Configuration is entered in JSON format. Example:
[ { "widget":"outagePropagation", "config":{ "outageProp":"outageDependency", "outageValue":"yes", "thresholdProp":"outageThreshold" } }, { "widget":"sumReport" }]Property | Values | Default | Description |
|---|---|---|---|
widget mandatory | String | ID of widget you want to enable (include) in Visualization. | |
config | Object | Optional object which will be passed to widget with <widget>.configure(config) method immediately after widget is included. Structure of this object vary for each widget. Please see documentation of particular widget for more information about it's configuration options. |