Powerful HTML5 based graph visualizations with cytoscape.js library works with every major browser and platform
Graphlytic supports the world's leading graph databases like Neo4j, Azure Cosmos, AWS Neptune, Memgraph, Apache TinkerPop, or JanusGraph.
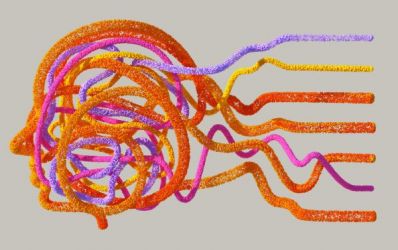
Look for patterns in your data with easy to use layouts, filtering or mapping data to visual properties like color or size
With Jobs it's easy to write and schedule your own scripts for importing data, searching patterns (with Cypher or Gremlin), and sending emails
Data analysis doesn't have to be a lonely job. Collaborate with other users and share your findings or export images and data
Contact us if you are interested in using Graphlytic in specific business cases. We are happy to help you with the setup


Native graph database with Cypher language, security, and data integrity for mission-critical intelligent applications.
Azure Cosmos DB is a fully managed NoSQL and relational database for modern app development.
Memgraph is an open source graph database built for teams who expect highly performant, advanced analytical insights.
Serverless graph database designed for superior scalability and availability.
Apache TinkerPop is a graph computing framework for both graph databases (OLTP) and graph analytic systems (OLAP).
JanusGraph is a scalable open-source graph database optimized for storing and querying large graphs distributed across a multi-machine cluster.
This is the simplest way to use Graphlytic. The service is ready in 5 minutes; then import the graph data or connect it to your existing graph DB. Create users, assign them to groups, and control which user can access which part of the data. You now have everything under control.
Starts at 19 EUR/month, scales with your needs.
When you need to work with highly sensitive data in a closed network the Graphlytic Server on-premises installation is advised. You can install the graph DB and Graphlytic on the same computer and start analyzing graphs right away. Check out the free Graphlytic LITE Server when you are a single analyst or request pricing if you want to discuss other options with us.
The first step is to import your data into the graph database. Any method of importing data into Neo4j can be used and Graphlytic's Jobs is one of such methods. Jobs can be run on-demand or scheduled to run automatically e.g.every night. With Jobs, you can keep your graph data up to date, send email notifications when something goes wrong or when a job finds predefined patterns (with Cypher) in data.
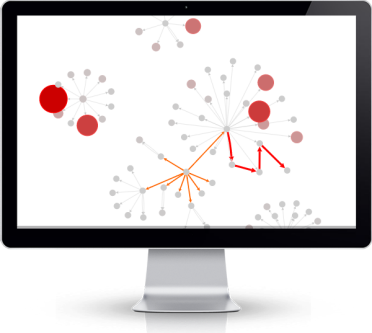
Search with fulltext in all data or in predefined collections of your graph data and find starting points for the graph visualization. It's easy to look for and to visualize graph patterns with the Cypher query language. Graphlytic provides an advanced graph search interface that can be used by non-technical users as well as by professionals.
Graph visualization is a powerful way to find patterns which can't be seen from a table or a chart. Different layouts reveal different patterns in graph visualization. Data to style mappings are used to enhance visual signal with properties like color, size, or shape of nodes and relationships. Filter out outliers; look for timeline dependencies; and get meaningful information as clear as possible.
Graph visualizations can be saved and reloaded later with automatic notification on any changes in the graph data. Visualizations can be exported as images or CSV files for use in different applications. Graph visualizations can be also shared with other users in the application to provide effective collaboration on bigger projects.