Expand Filter
With the expand filter you can select and filter nodes and relationships (based on their labels and property values) before they are added to the visualization when you are using the expand functionality in Graphlytic. This can be helpful when your graph model has nodes with a high degree which can lead to cluttered visualizations very quickly. Filtering can be also used for expanding only specific layers of the graph model.
How it works
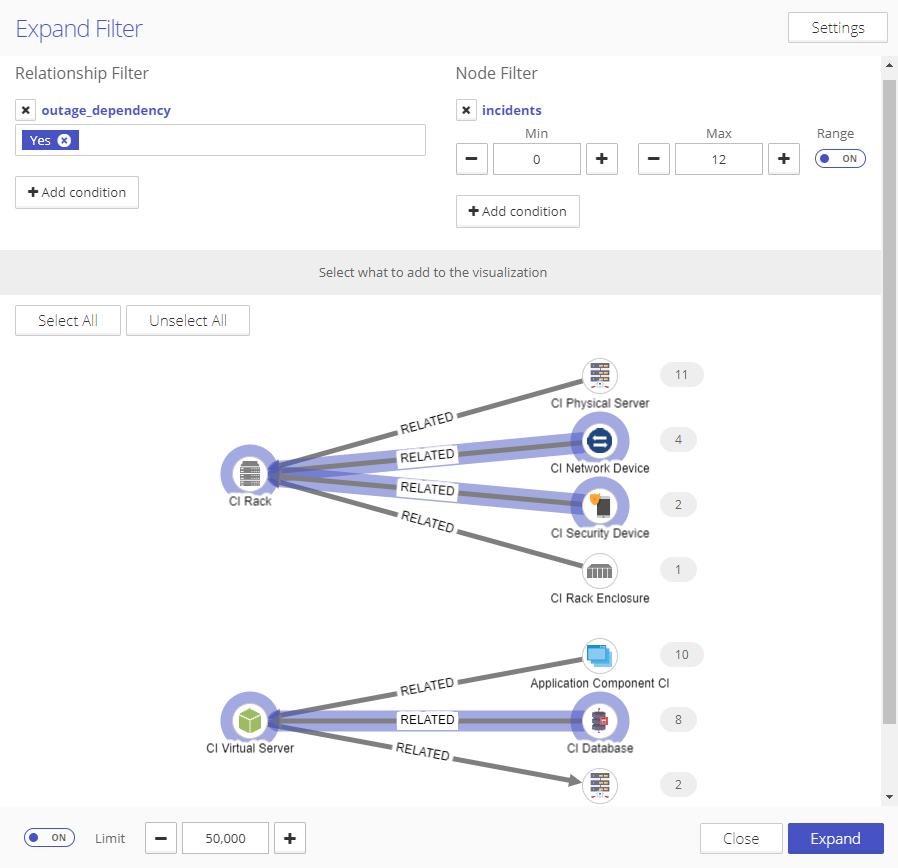
Add conditions for relationships and nodes based on property values (optional). This will filter down the number of elements that will be added to the graph.
Select relationship groups that should be added to the visualization by clicking on them in the visualized part. You can see the number of relationships that are in a group in the number pill on the right side.
Click on “Expand” to add selected relationship groups to the visualization.
Expand Settings
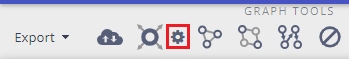
The expand filter settings can be opened with the settings (cog) button in the Tools panel right next to the expand icon.

Show filter options:
Always - the filter will be shown every time an expand action is performed.
Only large datasets - the filter will be shown only when an expand action should add more than the defined number of relationships. The threshold number can be defined with the “Ask when adding more than” setting.
Never - the filter is turned off and all relationships will be added with every expand action.