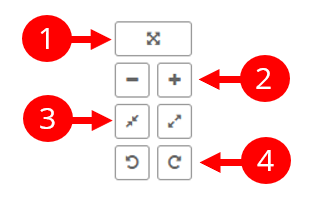
(1) Center view
Automatically set the zoom level and graph position to fit all elements of the visualized graph on the screen.
(2) Zoom in or out
Zoom the graph in or out on the screen. This operation is changing the relative size of the nodes and texts.
(3) Stretch the graph
Stretch or compress the graph. This operation is moving the nodes closer or farther from each other. The relative size of nodes and texts is unchanged.
(4) Rotate the graph
Rotate left or right the selected part of the graph. The whole graph is rotated if nothing is selected.