Announcing Graphlytic 3.5 is really a pleasure for me. We have worked several months on this release and it brings a lot of changes in the application architecture aimed at increasing the security and stability of the application, user interface changes with new features, and we have also expanded the options of free installation of the application.
Note: full release notes can be found here: Release Notes
Graphlytic LITE is free for everyone
Starting with the 3.5 release Graphlytic LITE is free for everyone. It has all the features of the Enterprise edition without user management. All the searching, visualization, customization, and graph automation features are there and it's completely free with easy self-activation during the first login. Install Graphlytic in a Docker container, or directly on the server/local machine, log into the application, enter your email address, click on the activation link in the email we will send you and that's it, the application is activated. We will add other download and installation options shortly, so stay tuned and subscribe to our blog.
Gremlin support
Gremlin-based databases like Azure Cosmos DB or Apache Tinkerpop using Gremlin 3.4 are now supported by Graphlytic. Simply choose the Gremlin connection type on the Settings page, put all connection values there and you can start with graph exploring right away. The Gremlin connection is still in beta with some advanced features not fully supported yet but we are laser-focused to bring our vision of seamless, no-code graph exploration into the world of Gremlin.
Shortest Paths Preview
This new feature allows previewing all shortest paths between any pair of nodes in the graph and to choose which paths should be added to the visualization. It automatically detects similar paths and allows to merge them into groups. The similarity of paths is determined by the types of nodes along the path. More information can be found in the video:
New search panel in the visualization
The capabilities of the search panel in the visualization were greatly improved. All types of queries (Fulltext node search, Custom queries, and Query Templates) are now available directly in the search panel. The panel itself was moved to the right to allow better interaction between the search results and the visualization itself.
Improved drag&drop import of files
Wizard for easy importing of CSV and MS Excel files was completely redesigned. The uploaded files are kept on the server for repeat use, imported elements can be visualized directly from the import wizard, imported elements have an import ID value set and a saved query is created to access them anytime with a few clicks. The mapping of start and end nodes for relationships was simplified and new options of creating labels based on the data in the file were added. The whole process can be seen in this video:
Graphlytic's Hybrid Data Model
The Hybrid Data Model is Graphlytic's solution for knowledge graphs with near real-time analysis of transactions with time-slicing (the Timeline feature). Its advantages are easy scaling, time slicing without the need for precalculating data, instant changes in the graph without the need for extensive recalculations every time a new transaction is added.
This approach can be used in many different use cases, e.g.:
- financial transactions (money flow)
- process mining (document transactions)
- communication (phone logs, email logs)
- system activity (trace logs, server logs, API logs)
The Hybrid Data Model is an approach using the combination of two data sources in the visualization:
- Graph Database - providing the graph structure and time-insensitive data, or all-time aggregates
- Document Database (like SOLR, Elastic, or any other document-based search engine) - storing detailed transactions and providing time-sensitive aggregations for graph relationships
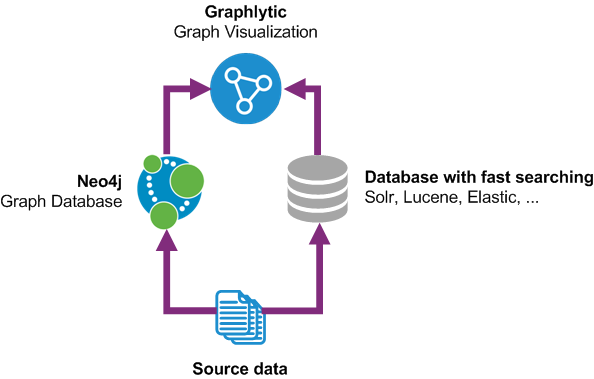
After configuration of the Hybrid Data Model, Graphlytic's visualization is able to seamlessly combine these two data sources to provide a unified view where the graph is enriched with aggregated time-sliced data from the document DB.
Graphlytic 3.5 has an integrated SOLR client making the usage of the Hybrid Data Model just about configuration with no coding required. It's still an advanced task to set up the infrastructure and get the data schema right but it brings a lot of new possibilities in transaction analysis. We will certainly explore the options in a separate blog post.
Michal Habala
CEO