I'm really proud to announce the 3.3 release. It's packed with new visualization features, improved user management, new integration options, and an official API documentation release. A concise summary of all changes can be found in the Release Notes.
I'd like to briefly mention a few great features and changes that I won't go deeper into in this post but should not be overlooked:
- Docker - starting with 3.3 we will be publishing Graphlytic in the official Docker registry. A brief Docker installation manual can be found here: Install with Docker.
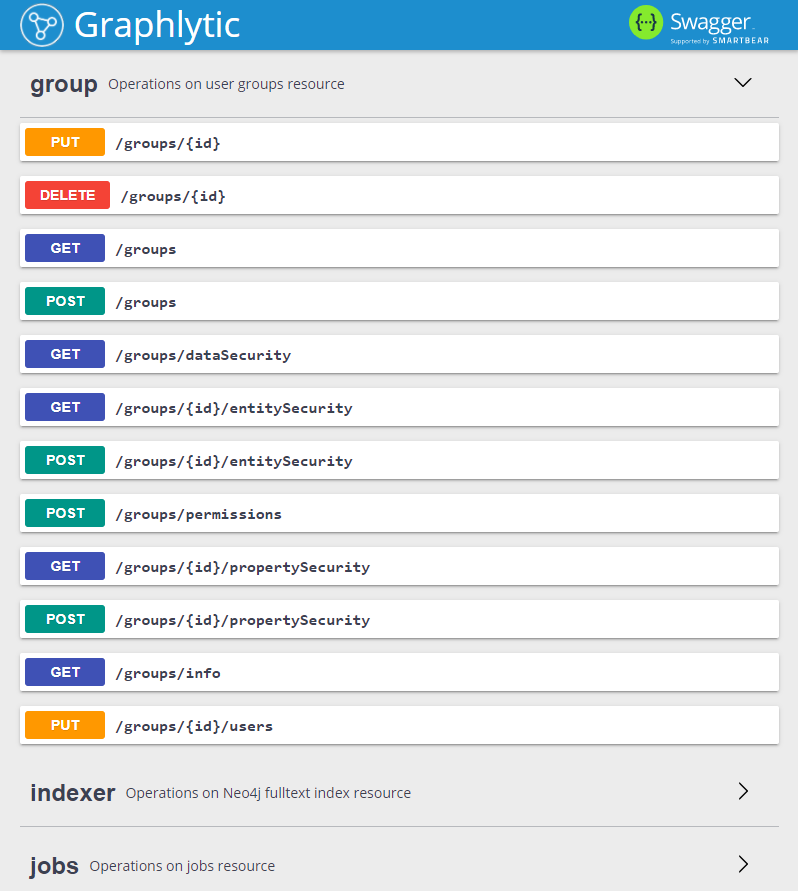
- Swagger UI - we have released the official Graphlytic Server REST API documentation based on the popular Swagger UI. It's bundled with the app, so you can test any API call directly with your Graphlytic instance. This can greatly speed up the implementation of any integration, whether it's with a CRM system or for business monitoring purposes.
Geographical maps
The defining feature of this release is, for sure, the Geo Map Server Integration available in the visualization. We have sponsored the implementation of an open-source Cytoscape.js plugin developed by Jan Zak. The cytoscape-mapbox-gl plugin uses Mapbox.js to create very nice vector or raster maps in the background of the graph. We have integrated the plugin into Graphlytic's visualization and made all the graph features work flawlessly with this great plugin. As a result, it's possible to freely explore your graph in the geo context and easily switch between graph and map mode. Users with permission to modify the graph data can also use Graphlytic to manually create geo-located graphs. Nodes can be dragged within the map, which results in changing the geo-location properties in the graph, allowing you to precisely put the nodes in the right spot on the map.
Graphlytic uses the free OpenStreetMaps but it can be integrated with almost any geodata server, including locally installed ones with offline maps. This can be especially useful in high-security installations, for example, in closed networks. There is a small explanatory installation manual that uses a free map server installed as a docker container in our docs.
If you want to see it in action, let me invite you to explore the world of Panama Papers in one of our online demos. It's free and registration takes only a few moments.
Visualization features
Besides the geo maps, we have also added other visualization features and new styling options. The main ones are presented in the next part, together with short screencasts; take a look and let me know in the comments which one you like.
We are adding new graph visualization options in every new release and the configuration of the default settings had become quite complicated. So, we have listened to our users and created a "magic" button that allows users with the Setting Permission to save all visualization settings as a global default with one click. This button is located on the Settings tab in the right-hand panel and it's called "Save as default".
And now let's take a look at the new features.
Grid layout
This layout was already used in some workflows, such as graph exploring and adding new query results from the search page and now it's available as a separate layout in the toolbox. It works like the other layouts; if there are some nodes selected in the graph, it repositions the selected part and if nothing is selected, it uses the whole visualization and focuses the viewport to fit the whole graph.
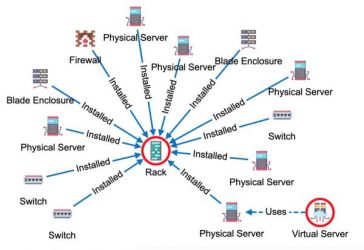
Taxi edges
Our IT management users requested the possibility to create these "taxi" edges, which are more suitable for IT network diagrams, so here it is. The taxi option was added as a new curve style, so it's even possible to make just some relationships use this style and others use the standard bezier curve. It's all configurable.
Another feature useful for modeling structural dependencies in IT networks, or software structures in refactoring use cases, are arrow types. There is a new style mapper available, called "Arrow shape", that can be used to change the arrow shape, based on your graph data.
Available relationship types are:
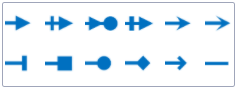
![]()
Integrations
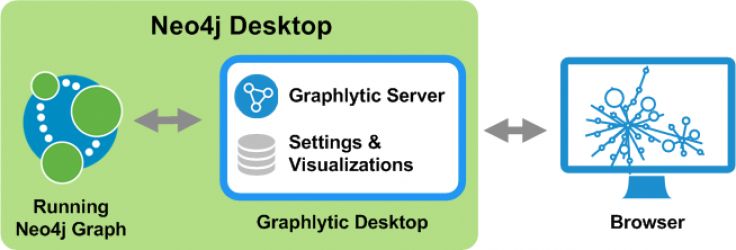
Integrations with specialized systems became an integral part of Graphlytic a few releases ago. We are now expanding this approach to bring every integration option together in one coherent ecosystem around Graphlytic. In this release, we are exposing all existing integrations in the Administration Manual chapter, called Integrations. The current state of the ecosystem is shown in the next picture.
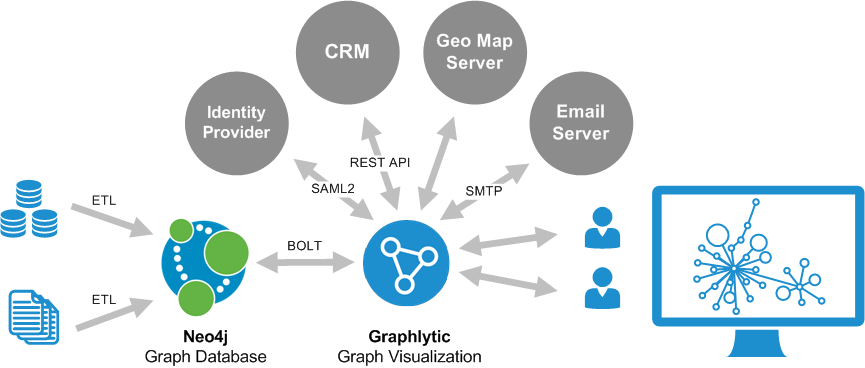
I've already mentioned the REST API documentation using Swagger UI bundle and Geo Map Server integration. Other integrations available out-of-the-box in this release are:
- Email Server integration: we've implemented SMTP integration for the purpose of user self-service password management. Workflows like sending out invitations to new users; forgotten passwords; or forced user password changes; are now available with no coding in every Graphlytic installation. The configuration involves changing the graphlytic.conf file and restarting the application, but this will be changed in the upcoming releases to bring every configuration into the UI for more convenience.
- Single sign-on: Graphlytic can be connected to an Identity Provider using SAML2. With features like: user group mapping; fallback group; and others, it's quite easy to configure the Single sign-on in your infrastructure. This concept will also be expanded in the next release to bring even easier configuration and more options.
Contact us at: support(at)graphlytic.com if you want to try Graphlytic, or if you need assistance with the configuration of any of the new features.
Michal Habala
CEO