Graphlytic 3.1 is all about new visualization features, monitoring, auditing, and improved documentation, mainly the Installation Manual.
Note: full release notes can be found here: Release Notes
Visualization
Selection Tools
The main visualization features added in this release are mainly about graph selections:
- Lasso batch selections - we've sponsored the development of a new Cytoscape.js plugin, the so-called Lasso plugin that allows selecting very specific parts of the graph without the limitations of the default box selection approach. The Lasso is now the default selection method but it's possible to revert back to box selection, just set it in the VISUALIZATION global setting.
- The selection state of the graph elements was also improved. Now the blue overlay depicting the selected state is changing its shape and size to match the selected graph elements. We've also added configuration options to change the color of the selection state and selection polygon in case the default blue/gray combination doesn't go well with your visualization style. Just set it in the VISUALIZATION global setting.
- Auto zooming was added in the exploring workflow, so now when you expand an element and it produces a large graph the auto-zoom will set the view to the newly added elements for better focus.
Here is a short clip showing all the mentioned features:
Dynamic Tool Menus
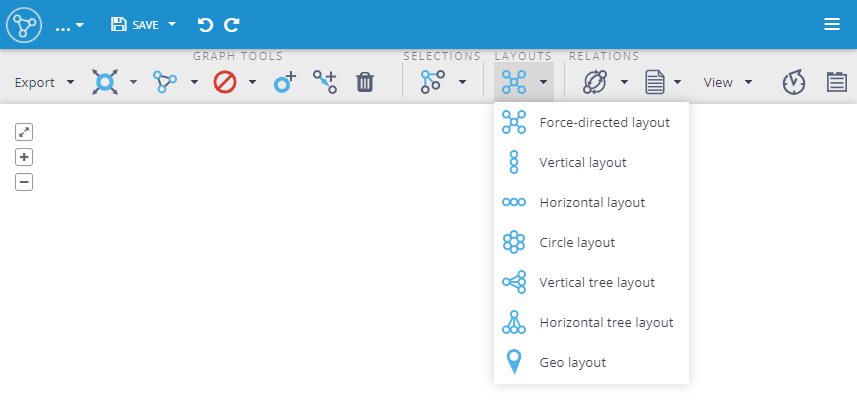
The Tool Menus in the graph visualization became quite overpopulated in recent releases because we have added a lot of new tools, like "Find all relationships", "Find Mutually related nodes", custom layouts, and others that took a lot of space in the horizontal Tools Panel. In order to keep the Tools Panel responsive and to give some flexibility over the panel apperiance we have added a drop-down menu options for:
- Paths (part of the Graph Tools menu)
- Selection Tools
- Layout Tools
- Relationship models
The fully expanded Tools Panel look's like this:

The menus can be collapsed into drop-down menus separatelly and with all of them collapsed it looks like this:
Monitoring
JMX remote connection is from now on enabled by default.
"Java Management Extensions ( JMX ) is a Java technology that supplies tools for managing and monitoring applications, system objects, devices (such as printers ), and service-oriented networks. Those resources are represented by objects called MBeans (for Managed Bean )." from Wikipedia page Java Management Extensions.
JMX can be used for in-depth Java monitoring (memory usage, garbage collection, number of instantiated objects, etc.). In Graphlytic, the JMX can be also used to stop running ETL Jobs.
More information can be found in the documentation: JMX Monitoring
Audit Logs and Audit API
There are quite a few changes in the audit logging capabilities, mainly:
New Auditing events were added
All frontend JS unhandled errors are logged in the frontend audit log
Custom extensions like widgets or third party applications using Graphlytic Server can log their events in the frontend log - API endpoint is mentioned in the Logging Documentation.
All audit log events can be read with the Audit REST API, take a look in the Logging Documentation for more details.