Our best practice shows that our experience and proficiency in data model definition and custom builds can be of great help for our customers for them to visualize and analyze their data. So, if you want to take full advantage of our unique data expertise, we would recommend you to go for custom on-premise Graphlytic deployment. In the following short article, you will find why.
In this case, the typical project of custom on-premise Graphlytic installation is generally a two-step process that consists of these points:
- Building a functional prototype
- Live operation in the production environment
Let us explain more in details.
1. Building a functional prototype
The main purpose of the prototype is to validate the customer’s assumptions on real customer’s data. In this phase, only a limited data sample is used to get visualized. The stakeholders and analysts on the customer’s side get their data into Graphlytic instance to test it as well as to prove the benefits of data visualization for their purposes and assess the fit with existing processes and applications.
Building a functional prototype typically consists of four stages:
1.1 Data model definition
This is equivalent to the analysis phase. We consider it to be the most important part of the Graphlytic development project. In this stage, the Graphlytic expert team together with the customer's dedicated team defines an optimal custom data model. The data model is strictly industry and use-case specific. The assumed effort for a specific data model design is usually just a few sessions. Exceptionally, in some cases it can take longer depending on the customer's requirements, the number of data sources, and the specifics of how the graph will be used to deliver added value.
1.2 Transformation of source data
Graphlytic experts transform the source data into the set of nodes and relationships (usually two CSV files) that are to be visually analyzed in Graphlytic. In certain use cases in this stage, cooperation with customer experts is helpful to speed up the process. Typical source data transformation is about extracting nodes and relationships from existing SQL databases or MS Excel records and can be done in a few hours but sometimes this step involves greater effort. For example, in use a case where we are dealing with source code analysis and refactoring, we a) can implement a functional plug-in for the specific programming language into Graphlytic back-end, if not already available, or b) a custom source code parser can be implemented, where such development is effort consuming activity and in such case, the cooperation with customer coders is of great help.
1.3 Data import to Graphlytic instance
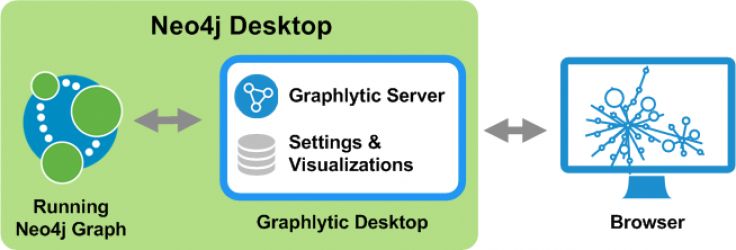
Two CSV files with nodes and relationships are imported into the Neo4j graph database using ETL scripts. Graphlytic has it's own lightweight ETL automatization module that we are using on most of the projects but an existing DWH and ETL infrastructure can be also used. The result of the data import is a populated graph in the Neo4j database.
Note: An existing Neo4j database can be used with no additional effort needed, just point your Graphlytic instance to the Neo4j endpoint and everything will work (Graphlytic is a turn-key solution).
1.4 Visualization and analysis
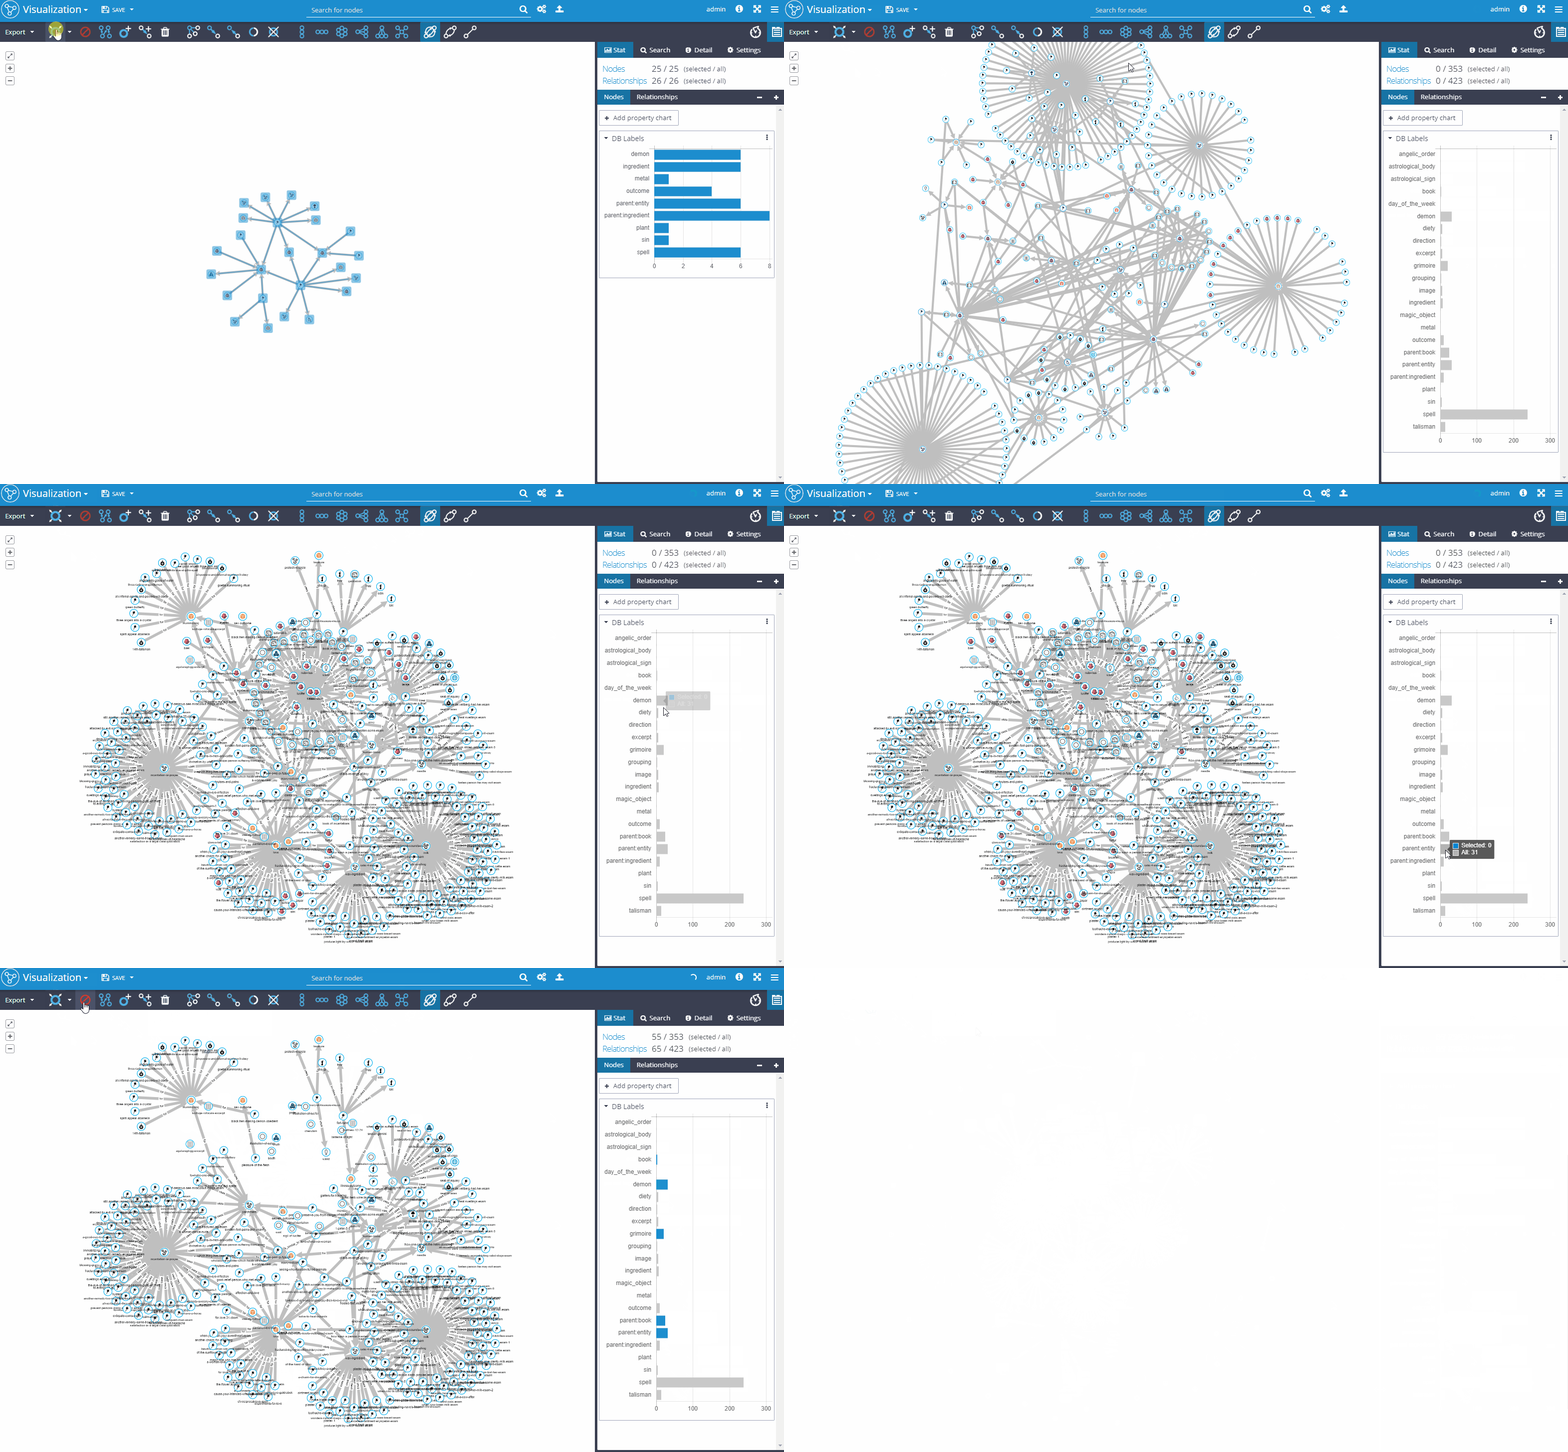
When your graph is constructed, you can start to visualize and analyze the data, find dependencies that you previously missed and analyze complex patterns that are hard to comprehend in traditional business intelligence and reporting tools. You can easily visualize even extensive data sets. You can share prepared visualizations with other users, save it for later use or export it. You can run automatized ETL jobs with various API integrations, JDBC connectors, logging, and emailing drivers or custom coded drivers.
Our experience shows that after having the prototype up and running, the customers usually get excited when finding their data visualized – organized in the structure that was not easy to imagine before.
Take a look at our short feature clips if you want to know more about what can be done in Graphlytic: https://graphlytic.com/features

2. Live operation in the production environment
The main benefit of the prototype is that the stakeholders and analysts can see their target solution with their data. The prototype though works just with a sample of data, on an isolated server or notebook. On the other hand, the prototype can be seen as the prerequisite for a really quick and comfortable deployment of Graphlytic into production infrastructure and among customer’s operational processes. This means that after having the prototype functional the discussion is about the steps needed to go into live operation across the company with the full data imported and updated regularly in defined periods, and with Graphlytic fully integrated to defined APIs and with all configuration that is needed. This project covers also the manuals and training for the customer’s staff.
The main advantage of the prototype is to have a perfect idea of where the solution is bringing value before any time & money is spent on engineering and infrastructure.
In case you want to know more about installing and configuring options of Graphlytic, please refer to our online manuals at https://graphlytic.com/doc/.
Please contact us at info@graphlytic.com for more information on how Graphlytic can help you with your project and we can schedule a short call where we can answer all of your questions.


