BENEFITS OF THE PARALLEL RELATIONSHIPS GRAPH MODELS
Graph models with parallel relationships are a perfect solution for use cases where you need to analyze events occurring between any two nodes in the graph. Events, in this case, are recorded interactions that:
- can happen at any point in time, or
- have a time validity range in which these events were happening.
For visualization purposes, it is very intuitive to model such events/interactions as relationships between graph nodes. In the case of multiple events occurring between the same pair of nodes, a new parallel relationship can be created to keep track of the changes over time.
Graphlytic's features like 'Timeline', 'Merging of relationships' and 'Virtual Properties' allow users to work efficiently with such graphs with benefits including:
- Simple graph model. Most of the time there is only 1 type of node in the graph (1 label) e.g. "Person" in communication analysis or "State" in workflow/process analysis.
- More data visualized with smaller and easier to understand graphs. Unlike the traditional models where events are modeled using separate nodes (e.g. fraud detection models), the parallel relationship model allows us to visualize the same source dataset with a much lower number of nodes and relationships resulting in much more compact and readable visualizations.
- Very few transformations during import and update of graph data. Basically, what we are importing are logs. Every row from such a log is represented with one relationship in the graph. This leads to easy data updating with a much lower chance of getting an inconsistent state in the graph.
Known limitations - every model has its pros and cons. Parallel relationship models have some downsides that should be considered:
- As every event (or interaction) is modeled as a relationship, it can be modeled only between two nodes (start and end nodes of the relationship). If you need to model events with more than two connected nodes it is probably better to use separate nodes as events that are connecting multiple other nodes.
- Large datasets with massive numbers of events (parallel relationships) can result in very long loading times because a high number of relationships are loaded in the visualization. Our tests show that if the model has a maximum of tens of thousands of parallel relationships between any pair of nodes it still can be visualized and used effectively (note: the overall number of relationships can be in hundreds of millions, that's not the limiting factor). With numbers beyond this, the performance starts to decline and other solutions are needed. One of the solutions is to use Graphlytic's Hybrid data model which allows the actual events to be stored in a separate database outside of the graph. Please take a look at the details below in the "Hybrid data models in Graphlytic" chapter.
Specific use cases that successfully utilize the strengths of parallel relationship models are for instance Scientific Research, Communication Analysis, or Process Analysis. For more details please take a look at this article: Top 7 Graph Use Cases for 2020. And How to Add Yours.
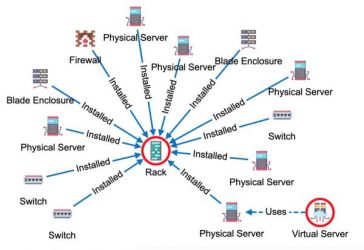
In the picture below, there is an example of a parallel relationship model used for the analysis of phone logs. Events are calls (relationships) between people (nodes).
Together with Graphlytic's Timeline, Virtual properties, and histogram filters, it is easy to filter out the core communication clusters (informal teams) from a large number of calls. This clip shows how to achieve it in a few moments:
BASICS OF THE PARALLEL RELATIONSHIPS GRAPH MODELS
The following parallel graph model describes intense communication between two objects. In this model, all relationships are visualized exactly as they are stored in the graph database. Every directed edge represents one event of communication. The arrow indicates the direction of communication.
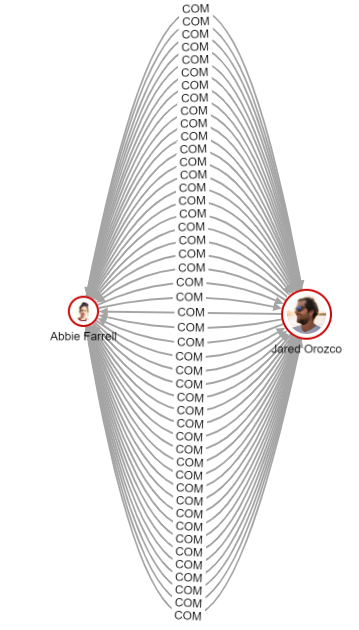
Such visual representation is the basic Graphlytic relationship model named: "Show all relationships".
To have all edges visualized select the highlighted 'Relationships' button in the Tools panel of the Visualization screen:

FEATURES OF THE PARALLEL RELATIONSHIPS GRAPH MODELS IN GRAPHLYTIC
Graph models with many parallel relationships are often very hard to visually analyze. The reason is that the high-density parallel relationships are cluttering the visualization. Over the years of using graphs for workflow, process, and communication analysis we have developed a set of features in Graphlytic that allows us to work with large numbers of parallel relationships easily.
This video shows the basic principles behind the merging of parallel relationships and using the use of the 'Timeline' filter to include only time-relevant relationships in the visualization view:
1. Virtual Relationship Models
For use cases with a high density of parallel relationships, Graphlytic supports two graph models with virtual relationships. In both of them, the parallel relationships are virtually merged into one relationship, which then represents an array of relationships.
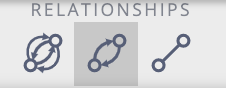
The first model of merged relationships "Merge parallel relationships with the same direction" merges parallel relationships with the same direction. As you can see in the diagram below, previously individually depicted relationships are merged in the same direction. In this example, the relationship is bi-directional. The number of interactions in each direction is shown over the merged edge. Styling of the visualization with the Style Mappers enables users to set individual visualization rules. In this visualization, with an increasing number of parallel edges, the merged virtual relationship is growing thicker with a more intense red color.

To switch to this graph model select the second button on the Relationships menu in the Tools panel:
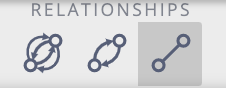
The second model of merged relationships: "Merge all parallel relationships" simplifies the visualization even more. It merges all relationships between two nodes and does not distinguish between the directions. This model is easier to render and therefore it is recommended for use it when you want to visualize large graphs.

This option can be selected by clicking on the third highlighted button:
- Documentation: Tools Panel
2. Virtual Properties
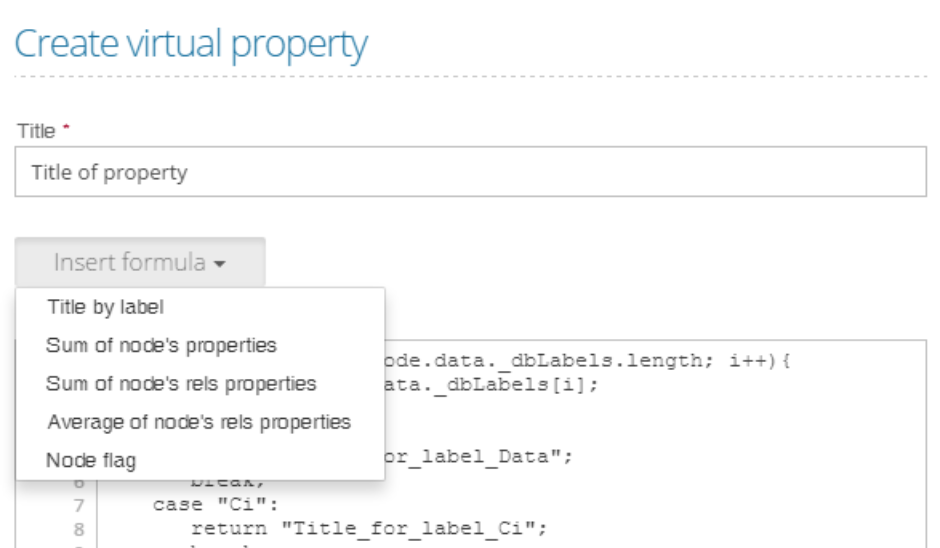
Virtual properties are the small JavaScript functions (called formulas) which are used to create properties based on values stored in an element or the elements in its neighborhood. This formula has to return a single value (string or number) which represents the value of the virtual property for the particular element. In the case of virtual relationships, it's possible to calculate a property based on data of merged relationships. Such a virtual property can return values such as the number of merged relationships, maximum, minimum, sum, average, or any other aggregation information of some properties stored in merged relationships. These virtual properties can then be used to filter data or to format the visualization, which leads to visual detection of the most common workflow paths or most common communication clusters.
You can use certain predefined formulas, modify them, or create a new one:
- Documentation: Virtual Properties
3. Timeline
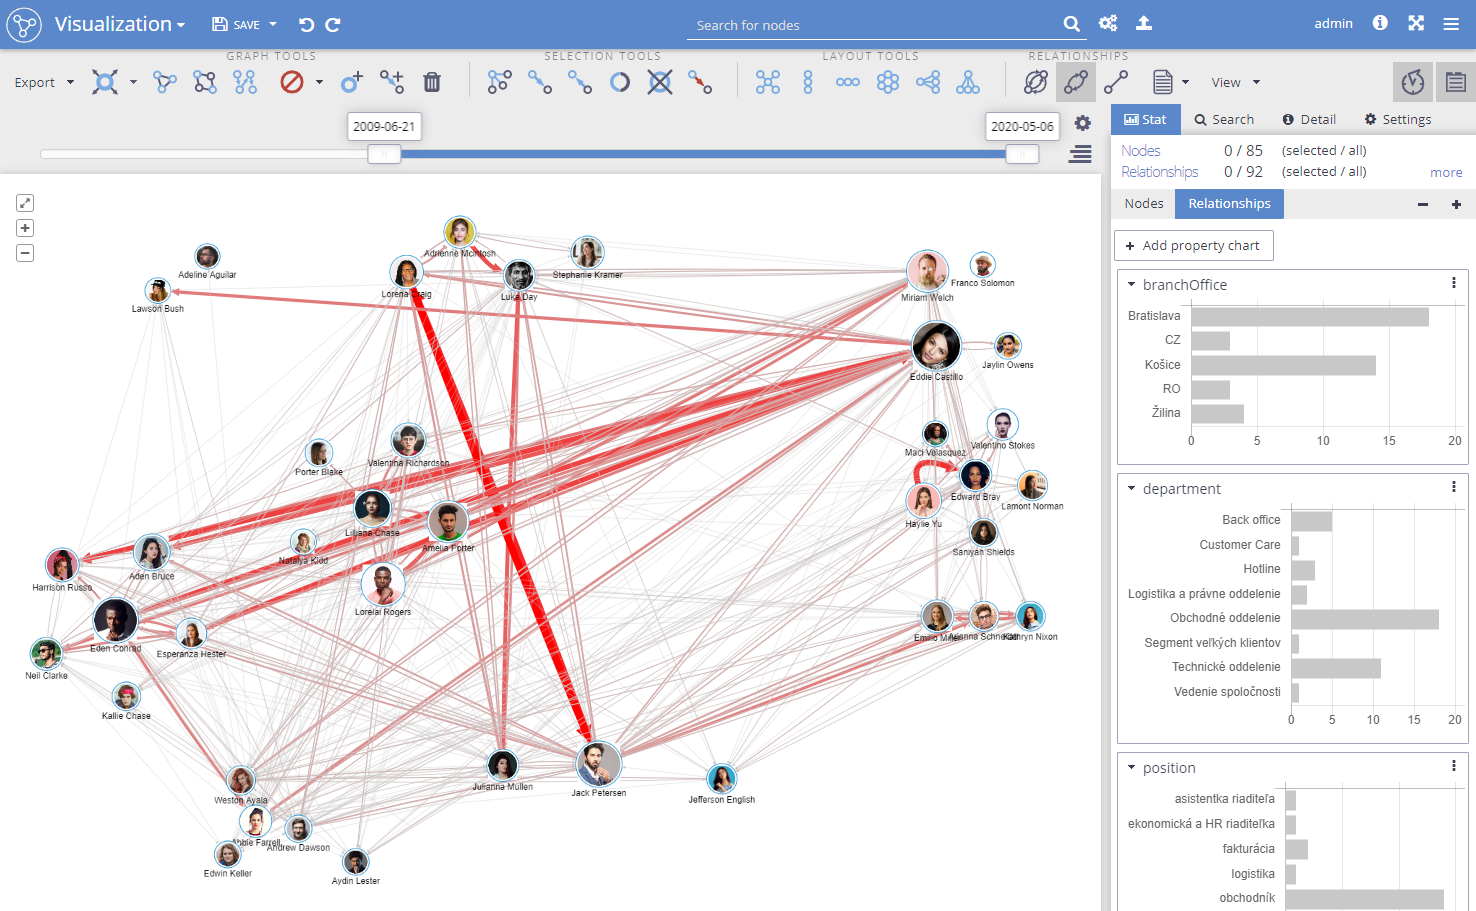
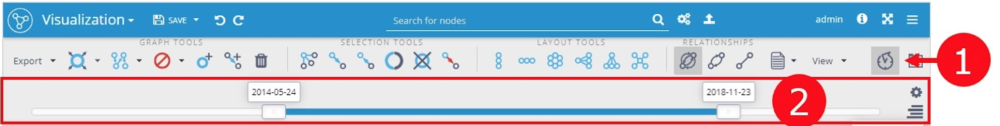
When the timestamp is stored for every relationship (date and time of the event occurrence) Graphlytic's 'Timeline' feature can be used to visualize a specified time interval. To turn on and off the Timeline, switch the icon marked with 1 in the below-attached Graphlytic visualization print screen.
After turning on the Timeline, you can easily manipulate the slider (marked with 2 in the picture below). This way it is easy to compare visualizations for different time periods like months or days.
- Documentation: Timeline
HYBRID DATA MODELS IN GRAPHLYTIC
Parallel relationships models are great in their flexibility and easy to set up and maintain features but in the case of large datasets with hundreds of millions of records, another approach is needed. The main issues are the loading and processing times in visualization and also performing any graph query can become very challenging. For such situations, Graphlytic supports Hybrid data models.
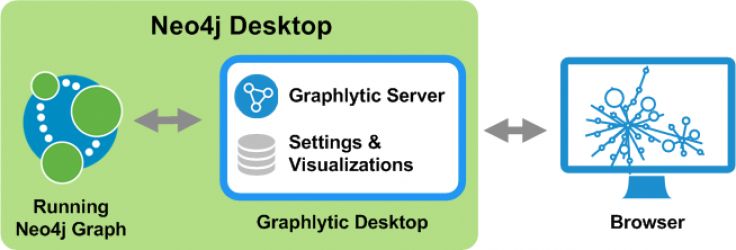
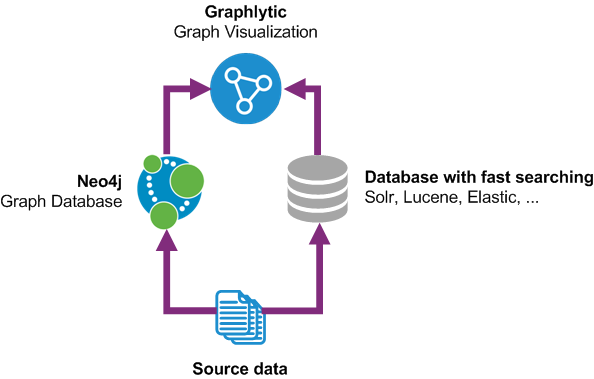
Hybrid data model is a model where only necessary graph data are stored in Neo4j without any parallel relationships. Detailed event data are stored in a separate non-graph database with fast and flexible searching, like Solr, Lucene, Elastic, etc. With proper Graphlytic configuration, such architecture can be used to combine visualization data from multiple data sources (hence the "hybrid" name) with great performance.
Simplified Graphlytic hybrid data architecture:
- only basic graph information needed to model the graph structure is stored in Neo4j
- event data are stored in a separate non-graph database
- Graphlytic combines these two sources in the visualization for maximum performance
If you are interested in using the Hybrid data model please contact us and we will help you with the assessment and architecture design.