From start-ups to multinationals, businesses all over the world are dealing with highly interconnected data. Today more than ever.
Graph databases are the perfect solution for this - bringing incomparably faster results compared to relational databases, reducing calculation times from minutes and hours to milliseconds, thus rapidly increasing efficiency.
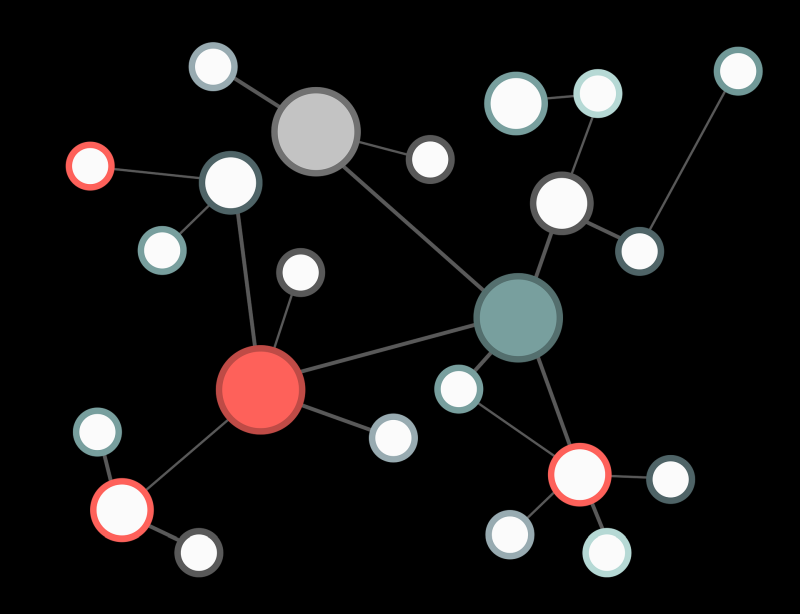
Graph visualization and analytics slice and dice highly interconnected data to examine the details from different viewpoints.
Graph databases combined with graph modeling and visualizations are an unbeatable combination for specific analytics and specialized projects. These might generally focus on two main areas:
1. “Patterns” – they define, search for, and unveil specific patterns among highly interconnected data. Graphs enable analysts to dig deeper, finding hidden relationships or relationships of neighbors’ neighbors to a defined level – which is a unique strength of graphs. Additionally, in conjunction with any given machine learning loop, they help to drive new data-based service innovations.
In this area, we can find:
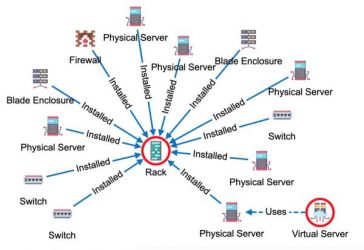
- Use case #1: The operations of large IT networks with many elements (as racks, physical and virtual servers, databases, and services) with defined dependencies in various structures and levels, where graphs enable modeling to:
- prevent single points of failures (so-called SPoFs) – which help to prevent losses,
- plan network maintenance and outages better – with improved time / financial efficiency,
- generally better plan operational costs to manage total costs of ownership (so-called TCOs)
- even add financial parameters of revenues to network components to calculate revenue loss per service or product dependent on the outage of a network component that is causing an outage of the certain network branch; for more details see: Infrastructure Visualization
- Use case #2: Fraud detection and prevention in banking, insurance or any business area where organized groups can create sophisticated fraudulent patterns, causing significant losses in precisely planned time frames; find out more here: Graphlytic For Fraud Detection In Banking Insurance Or E-Commerce Industry
- Use case #3: Software source code refactoring which might to some be a boring and annoying activity without graphs. When adding graphs coders and analysts can easily define and find unwanted or repetitive patterns in calls within the code, and remove them; for more details and simplified process of refactoring with graphs see: Code Refactoring Using Graphs
2. Specific parameters of relationships among nodes - as parallel relationships in one or both directions between every two nodes, virtual properties with algorithms set on the relationship, the strength of relationships, etc.
This point of view enables analysts to prepare different types of analytics applicable to:
- Use case #4: Scientific research in any field (such as medicine or physics) where graphs mainly in combination with machine learning and natural language processing (so-called NLP), significantly speed up the research process in testing the hypothesis based on the strength of relationships among piles of single data records (depicted as nodes in graphs),
- Use case #5: Communication analysis leveraging a parallel relationships model which is based on an analysis of cumulative logs from communication events between any given pair of nodes. Nodes might represent people in various positions (employees as components of structured or virtual teams, customers, contractors, etc.). Events are defined as data records containing logs from any business communication (phone calls logs, e-mail, or other company communications logs). This kind of analysis might use clustering to structure and set thresholds. They generally help to reply to the following types of questions: How intensely certain teams communicated over a certain period. Whether the intense communication was between the right members or teams. Whether the intensity of the communication changed due to some organizational, or external changes? Find out more about what kind of organizational problems are solved by the communication analysis: Communication Visualization
- Use case #6: Process analysis uses the graph concept with parallel relationships as well. In interactive process analysis nodes represent states that analyzed entities can be in and relationships represent events where some entity has changed its state. Every entity (document, customer, product, etc.) might and most probably will change its state several times. Every change recorded in a relationship has to have at least the entity_id and timestamp properties. The complete process for each and every entity is modelled as a chain of consequent status changes.
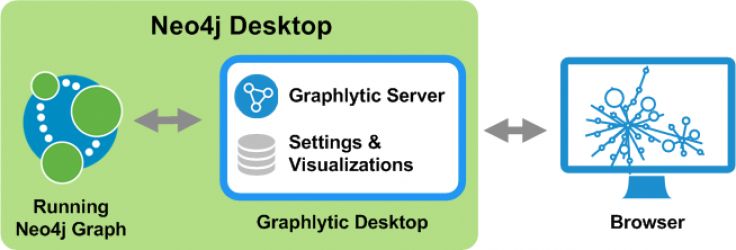
The optimal setup for any of these use cases is:
Graphlytic for graph visualization, modeling, and analytics with the Neo4j graph database for storing data in a graph structure.
Graphlytic can be used as:
A) Graphlytic product ordered by the end-customers where standard product features and various support levels are available.
In this category previous experience with graph databases and Neo4j on the customer side is an advantage, but not a prerequisite. Graphlytic UI is intuitive and does not require knowledge of any programming language. Graphlytic experts in specific cases support customers with server installation or custom extensions development.
Product alternatives besides the Graphlytic server enterprise license with full feature set (including user and group permission management) are the Graphlytic in Neo4j desktop (with a free single-user license and really simple installation) and Graphlytic cloud instance (a full feature product with flexible scaling and licensing supporting customers’ growth).
B) Use case #7: Monetization platform for professional services providers to deliver graph-based services to their end-customers - a platform with custom extensions prepared based on customers’ requests.
The customers here are mainly technical specialists who have a serious background in graph theory, and graph technologies, programming, and data science areas. The typical customers are technology businesses with graph-based professional services to their end-customers.
Customers using the Graphlytic platform prepare their environment based on data stored in Neo4je graph structures.
Graph records are then visualized in the Graphlytic environment. The type and structure of graph data depend on customers’ fields of business and project targets. The Graphlytic team supports customers in validating their intentions with graphs.
After evaluating how Graphlytic features meet customers’ goals and expectations, both parties are heading for agreement on the next steps. The main parts to agree on are the:
- roadmap and milestones,
- process of custom extensions development covering agile development principles, generally with regular virtual stand-up meetings,
- technical support parameters, if requested,
- technical documentation,
- legal documentation - generally Master Agreement followed by Statements of Works (so-called SoW) reflecting the agreed amount of effort in defined periods.
Examples of the graph-based professional services to the end-customers that could be provided on a graph visualization platform based on the underlying graph database:
- Enterprise communication analysis built as a product to enterprises of all kinds, as end-customers. Deliverables here could be automatized and generated regularly, e.g. monthly based analysis of communication among internal teams, communication towards end-customers’ customers, etc. Graphs here serve as an easy to learn and easy to use user interface for regular analysis. For more on enterprise communication analysis read here: Communication Visualization
- Scientific research using NLP and AI to validate the hypothesis to speed up the processes of developing brand new products or materials. Sources could be in an unstructured form of documents to an unlimited amount. Researchers will define the keywords. NLP experts will help with getting data to the structure. Graph structures will store highly interconnected data. Graphs again are used as an intuitive and interactive user interface. This model is fully applicable to any research field.
- Government and healthcare – graphs in combination with geo-widgets in the monetizing platform can reveal information on how an infection might have been spread across the population.