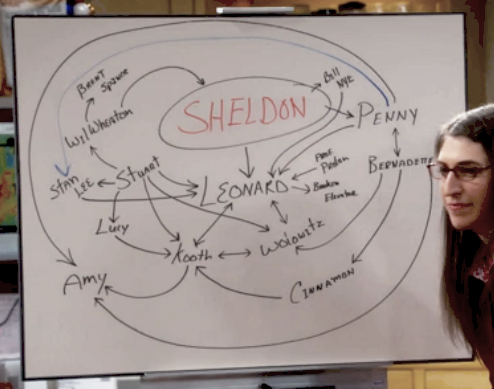
It's probably unnecessary to introduce The Big Bang Theory sitcom. No matter what you think about the series the chances are that you have seen this picture from the eleventh episode of the seventh season named "The Cooper Extraction" where Sheldon’s girlfriend Amy comes with the theory that none of Sheldon’s friends would be there if it wasn't for Sheldon:
Source: BigBangTheoryFandom.com
She draws this graph of the absent Sheldon premise to prove that without Sheldon the sequence of events that led to the creation of a happy relationship between Leonard and Penny or between Bernadette and Wolovitz would never have occurred.
And here, we got inspired - what if we import the graph into Graphlytic a give it a bit more styling and interactivity... and this blog post will show you exactly how to do it.
There are several options how to import data into a graph database using Graphlytic:
- Draw new nodes and relationships one by one in the Graphlytic visualization.
- Use an ETL job to import data. This is really useful if repeated imports are needed. For more on how to run ETL jobs please refer to ETL Jobs.
- Use the manual file import from any spreadsheet (CSV or Excel).
In this blog post, we will focus on the 3rd option - the manual file import.
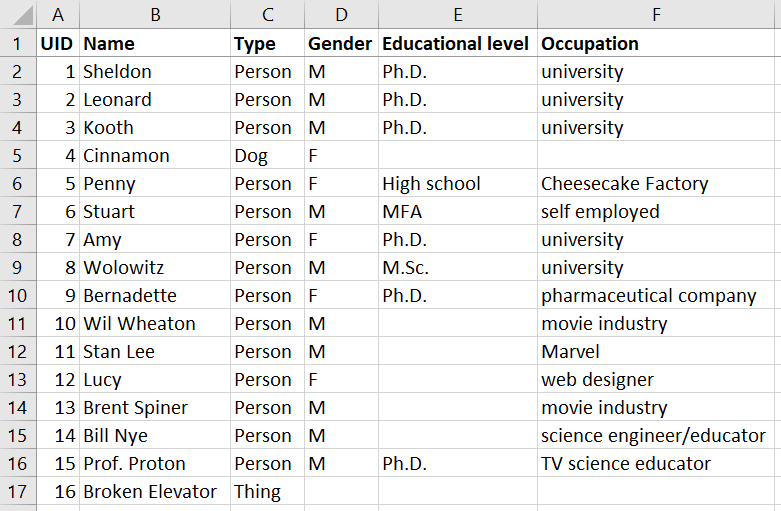
First, we need to translate Amy’s diagram into two sheets (tables):
- Nodes - every sitcom character will be represented in one line with a couple of metadata properties like Type, Gender, Education level, etc.
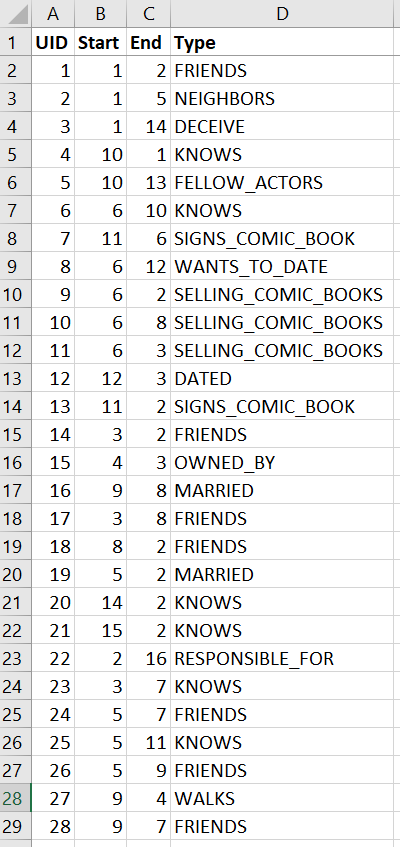
- Rels - every relationship between any two nodes will be represented in one line with references to the start and end node and a type.
In Amy's graph the relationship orientation is not exact so will be considering every relationship to be bidirectional or unidirectional based on the context of that relationship (based on its title).
Nodes
Relationships
Upload the Data File
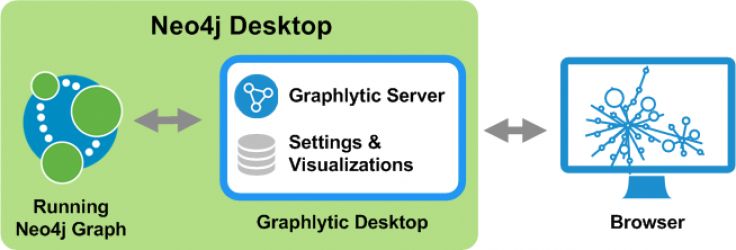
Having the set of nodes and relationships prepared we’ll switch to Graphlytic environment to import the data - open a new (blank) visualization and press the "Import" button and drag&drop the spreadsheet into the import window to upload it to the server:
Import Nodes
The first step is to import the nodes using these steps:
- Click on the uploaded file.
- Set "Import as" to "Nodes".
- Select the "Nodes" sheet from which the nodes should be imported.
- Select the column "Type" to be imported as node labels.
- Hit "Import" and then "Visualize elements"
Import Relationships
When importing the relationships, we need a bit more effort. These steps have to be completed:
- Again, we start with the same uploaded file by clicking on it in the import window.
- Set "Import as" to "Relationships".
- Select the "Rels" sheet from which the relationships should be imported.
- Select the column "Type" to be imported as relationship types.
- Start node matching
- Select the column from the file which has the identification of the start node of the imported relationship.
- Select the node property in the graph which has the same identification value of the start node.
- End node matching
- Select the column from the file which has the identification of the end node of the imported relationship.
- Select the node property in the graph which has the same identification value of the end node.
- Hit "Import" and then "Visualize elements"
During import, the application will match the start node and end node based on the mapping selected in steps 5 and 6. If the identification values are not unique then multiple relationships can be created from every line in the uploaded spreadsheet.
Styling the Visualization
Finally, we can add a few icons and colors to the visualization based on the imported properties.
I'm sure there are a lot more relationships between the sitcom characters and Amy's graph is not used to the max. What other relationships should be added? Leave your tips in the comments below.