In this article, we will focus on using graphs when analyzing potential fraud situations in banking.
Two important notes.
First. Sophisticated fraudulent groups operate in insurance or e-commerce industries too. Fraud patterns created by organized groups may differ across industries. Then, the main difference is in the type of event that needs to be analyzed. Insurance analysts and investigators search for potential fraudulent behavior in car crash accidents or injury events where fraudsters file false claims and collect money. Bank fraud analysts have to connect dots between suspicious events like payments, time events, etc. We’ll describe a few of them later in the article.
Second. Using graph databases with graphs for highly interconnected siloed data brings not only the benefits of faster results and a deeper understanding of how patterns are created for fraud analysts solely. Banks, insurance companies, or e-shops that started to use graphs can step-by-step put more data from any source into the graph databases to get a more extensive comprehension of many various use-cases like knowledge graphs or customer experience improvement. Some of these use cases will be published in separate posts.
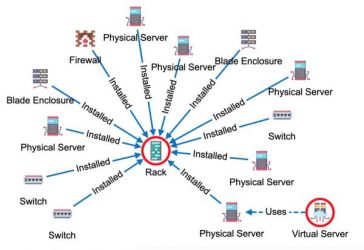
The following picture describes both above-mentioned points:
- Events are the triggers for the start of any potential fraud investigation.
- Graphs and graph databases are perfect for highly interconnected data. As they are much faster with these data compared to traditional RDBs. So, when a company starts with graphs it can leverage any source of data – customer data, marketing, and sales data, own internal or 3rd party data – for any other specific relationship-driven analysis.
When mentioning fraud detection, we are pointing to a potential customer fraud scenario – in the retail banking consumer fraud scenario.
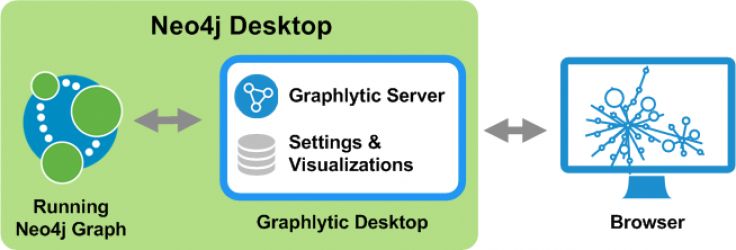
The following graph prepared in Graphlytic contains few details related to the consumer that come from different sources – consumer data in green, products (marketing and sales) data in orange, and a sample of 3rd party data relevant to the consumer in gray.

Nothing suspicious so far :)
But when talking about potential fraud detection modern fraudsters:
- Operate as organized groups called bank fraud rings. Such a group can consist of several criminals (number may even reach 10+) attempting to steal from financial institutions. Bank fraud rings use stolen personal information to apply for bank accounts, stolen credit or debit card numbers, or fill in false loan applications.
- Use synthetic identities. Fraudsters combine real and fake data to create new synthetic identities. Fake data may come from physically stolen data (IDs, documents, credit cards, etc.) or personal information stolen in the internet environment. With these false identities, bank fraud rings try to obtain credit, make purchases, or open new accounts. Synthetic identity fraud is evolving significantly. In the U.S. synthetic identity fraud is responsible for 20 percent of credit losses, with an average charge of $15,000. [1]
- Hijack consumer devices and steal identity using hacking. This is designed to steal personal data using various techniques as fraudulent e-mails requesting personal information or websites that are infiltrated by malware like Trojan horses, worms, or viruses. Every day millions of users are submitting their personal information (such as their names and addresses, debit card numbers, ID numbers) into millions of online forms to make their purchases, validate documents, or communicate with governments or with each other. Hackers, with a growing scale, are discovering ways to exploit vulnerabilities in all those systems.
One of the ways to detect and actively prevent fraudulent activities is to use graphs.
When analyzing potential fraudulent situations, the bank analyst looks for patterns of suspicious behavior.
For example, two consequent payments to the same external account might be all right. But if the account was previously red-flagged, the pattern might be part of a bigger fraud pattern.

When fraudsters acquire credit card details, they might try to do a few small transactions. Usually, this is done with one or the whole pool of stolen cards. Which is the way to verify which cards work. When confirmed this, the fraud rings use the whole pools of functional cards to steal from banks in big.
So, bank analysts might look for patterns of transactions that would indicate this scenario. They might inspect the payments which, in the following example, were done in an interval of a few seconds. When analyzing the event, the analyst might find that the transactions were done from different IP addresses, in addition to different parts of the world.

That most certainly was a fraudulent event. If this simplest pattern appears repeatedly in a short period of time it was part of a bigger fraud ring.
This way the bank analysts observe, find, and define similar and much more complicated patterns that might represent fraudulent behavior.
The power of the graph shows that:
- If there is a separate pattern of fraud, bank analysts may find the same pattern in the whole pool of transactions.
- Simple patterns often create one or a series of complicated patterns.
- Bank analysts may use graphs from detection to prevention and protection – the systems may react pro-actively when certain patterns appear.
- Graphs working in a loop with machine learning algorithms may help to find new fraud patterns.