Timeline
Table of Contents
Graphlytic's Timeline is a filter for filtering out nodes and relationships based on date and time data stored in their properties.
1. Controls
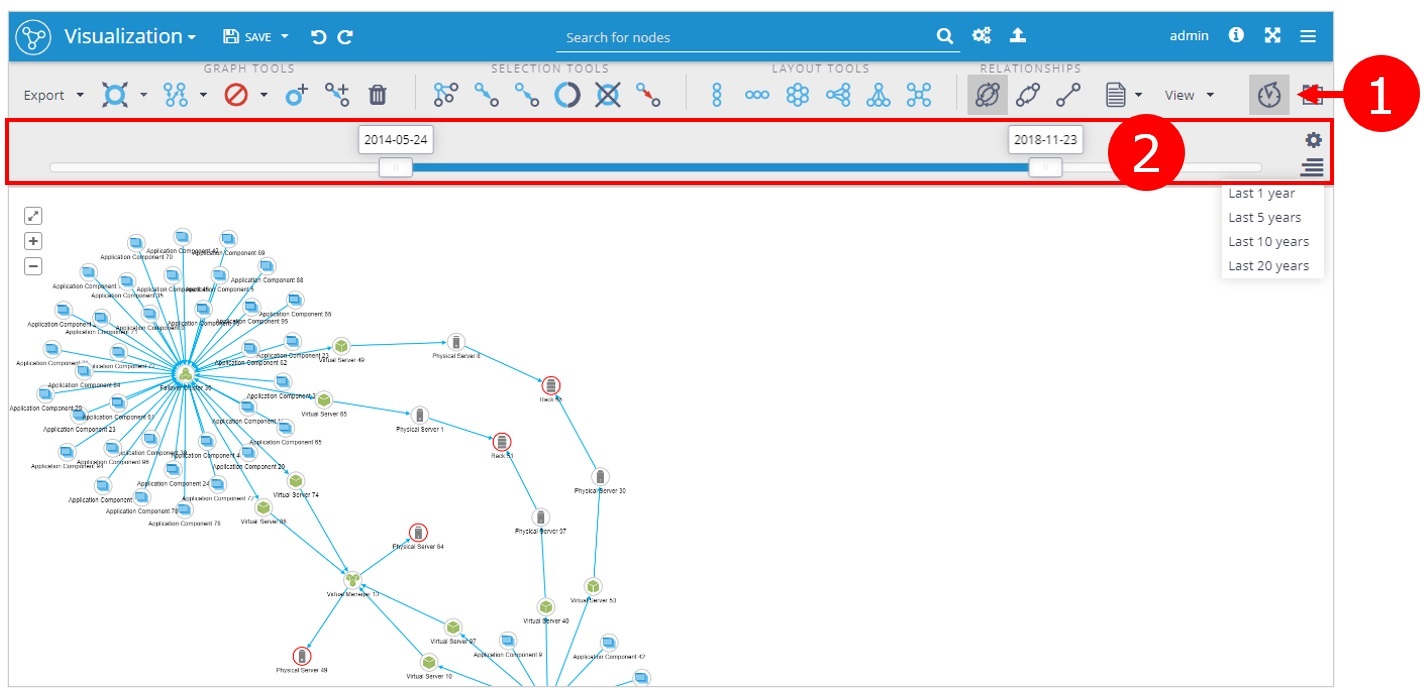
1.1. 1) Timeline switch
The timeline can be switched on and off with the timeline switch in the Tools panel : ![]()
1.2. 2) Timeline slider
Slider for setting the time interval which will be visualized. The logic of filtering out of nodes and relationships based on their timestamps is explained in the chapter "Filtering" (see below).

1.2.1. Timeline profiles
Timeline profiles are definitions of database properties that should be used to compute timeline validity data for graph elements (nodes and relationships). It's useful to have different timeline profiles if you need to analyze the graph in regard to different business dates defined as separate timeline profiles.
Profiles are available (the icon is displayed) only when Timeline profiles are defined in the global setting Visualization Settings.
1.2.2. Timeline ranges
With the Timeline ranges menu it's very easy to preset the most used past intervals like "Last 1 year" or "Yesterday". Choose the appropriate interval with this icon: ![]()
A range is a number in milliseconds that will be used to set the range after picking it. The maximum value of the Timeline slider will be set to the maximal value possible and the minimum value will be set to the maximal minus the range value.
A list of available ranges can be configured on the global level in the Visualization Settings.
2. Data model
The timeline filter is based on the premise that every element (node or relationship) can be created once and deleted once so every element can have 2 properties defined which represent the "start date" and "end date" of the element's lifespan. These two properties together with the datetime format can be configured in the Visualization setting.
If your data model has only one datetime point (e.g. events or workflows) then simply set "start date" and "end date" to the same datetime (the same property can be used in the configuration).
3. Filtering
Everytime the Timeline interval is changed the data snapshot in visualization is recalculated with only time-relevant elements. The relevancy is calculated based on the "start date" and "end date". More can be seen in next picture where are 3 nodes and 1 relationship with different time relevancy shown in different time intervals.
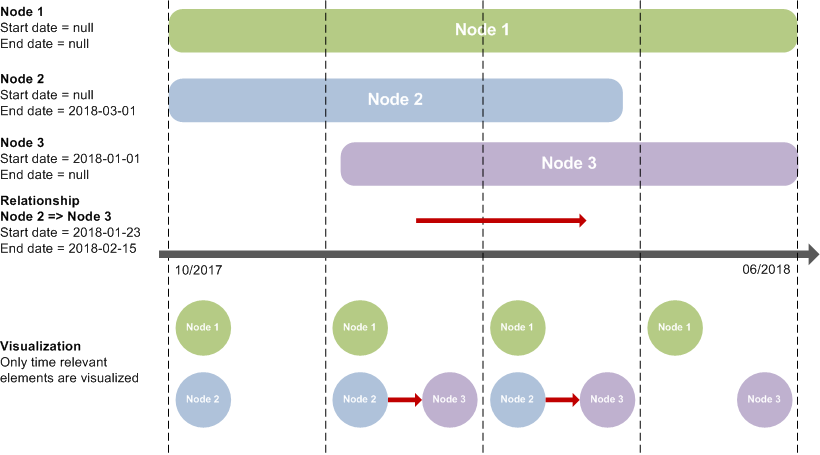
Above the time axis: time relevancy of graph elements visualized as bars with start and end according to the time axis.
Below the time axis: elements that will be visualized if the time interval is set according to the vertical dashed lines.
4. Configuration
The timeline has to be explicitly defined in the Visualization setting otherwise it's deactivated and can't be started in the visualization.