Gartner, Inc. is the world’s leading research and advisory company and a member of the S&P 500.
As we value research and keep pace with technological trends, we decided to take a look at the trends in the graph analytics in Gartner's press releases.
Gartner identified graph analytics as one of Top 10 Data and Analytics Technology Trends for 2019 with tremendous annual growth through 2022 as follows:
“Trend No. 5: Graph
Graph analytics is a set of analytic techniques that allows for the exploration of relationships between entities of interest such as organizations, people, and transactions.
The application of graph processing and graph DBMSs will grow at 100 percent annually through 2022 to continuously accelerate data preparation and enable more complex and adaptive data science.
Graph data stores can efficiently model, explore, and query data with complex interrelationships across data silos, but the need for specialized skills have limited their adoption to date, according to Gartner.
Graph analytics will grow in the next few years due to the need to ask complex questions across complex data, which is not always practical or even possible at scale using SQL queries.”
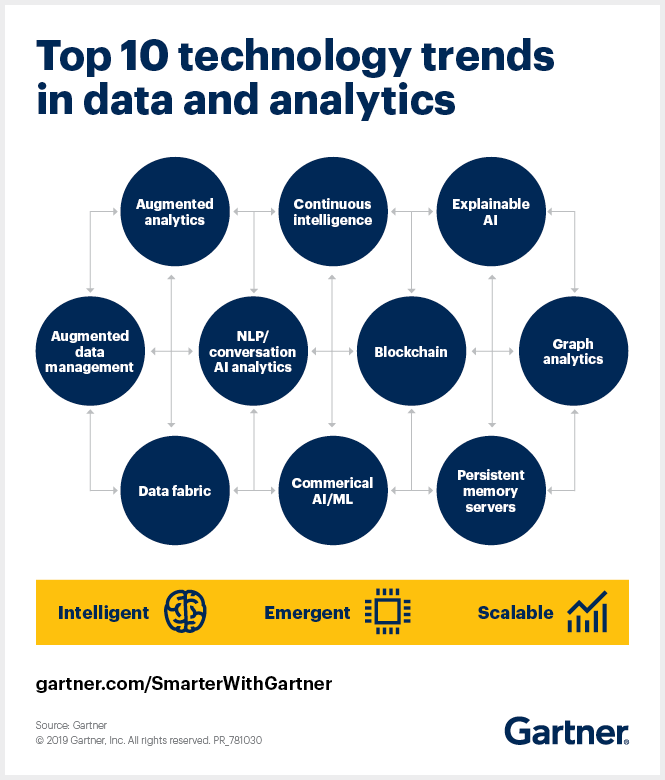
Figure 1. Top 10 technology trends in data and analytics, 2019
Source: https://www.gartner.com/smarterwithgartner/gartner-top-10-data-analytics-trends/
In this press release, Gartner Identifies Five Emerging Technology Trends With Transformational Impact that was revealed in The Hype Cycle for Emerging Technologies (see below Figure 2.).
Following this press release graph analytics belongs among technologies to be tracked in the emerging trend Advanced AI and Analytics:
“Advanced analytics comprises the autonomous or semiautonomous examination of data or content using sophisticated techniques and tools, typically beyond those of traditional business intelligence (BI).”
and
“The technologies to track include adaptive machine learning (ML), edge AI, edge analytics, explainable AI, AI platform as a service (PaaS), transfer learning, generative adversarial networks, and graph analytics.”
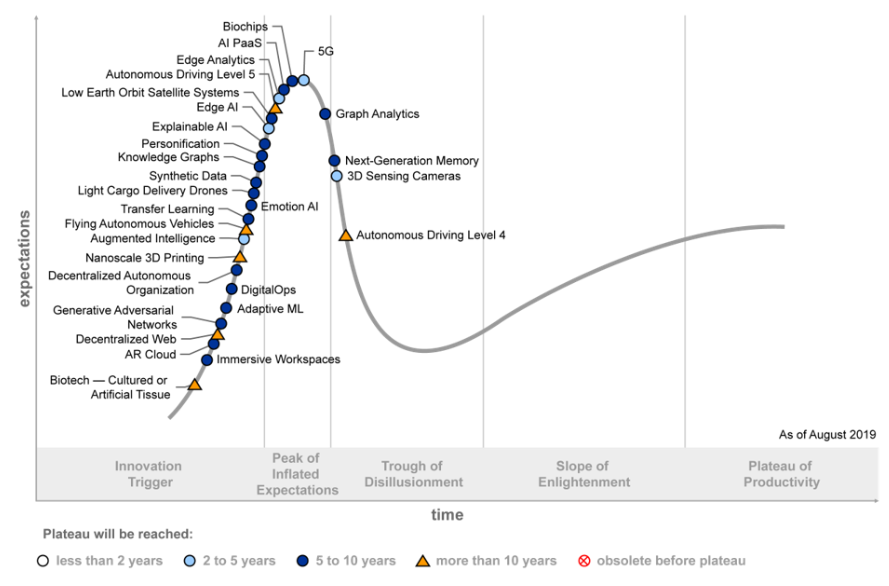
Figure 2. Hype Cycle for Emerging Technologies, 2019
As we can see on The Hype Cycle for Emerging Technologies, Knowledge Graphs are on the shift from Innovation Trigger to The Peak of Inflated Expectations showing significant potential.
And last but not least, Gartner just published press release: “Gartner Identifies Five Areas Where AI Can Improve Decision Making for Government and Healthcare CIOs During the Coronavirus Pandemic” saying that one of this five areas were using AI graphs to combat COVID-19 will have the most impact is:
“Vaccine Research & Development (R&D)
AI graphs and natural language processing (NLP) can enable medical researchers to scour through many thousands of relevant reports to draw connections between data at an unprecedented pace. Augmented vaccine R&D also identifies coronavirus countermeasures including those that have already been tested on humans.
“Healthcare CIOs and CDOs should explore every avenue of AI to fight COVID-19 using an ongoing and systematic process of AI application identification and prioritization. Technologists should not overestimate their ability to understand what makes sense from public health and medical perspective and then work with healthcare professionals to create and actively advertise an open marketplace that shares AI applications, models and data transparently,” said Mr. den Hamer.”