Graphlytic concepts
Table of Contents
What is a graph
We use graph terminology in consistency with Neo4j. To check Neo4j graph modeling concepts or terminology see the description of Neo4j graph database concepts.
Graph
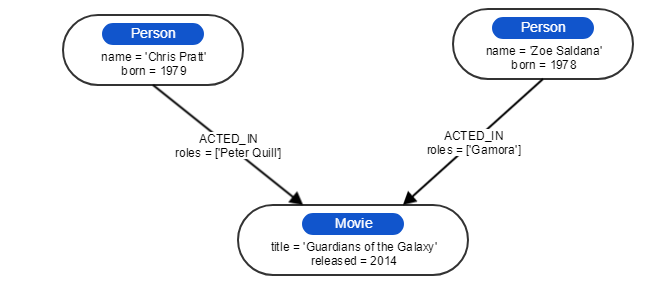
When we are talking about a graph we mean a property graph, a graph that contains a set of nodes and directed typed relationships between these nodes. Each node or relationship may have zero or more properties. This graph is stored in a database.
Node
A node is a data record within a graph. Contains an arbitrary collection of properties. Nodes may have zero, one, or more labels and are optionally connected by relationships.
Label
Marks a node as a member of a named subset. A node may be assigned zero or more labels.
Relationship
A relationship is a data record in a property graph. Relationships organize the nodes by connecting them. A relationship connects two nodes - a start node and an end node (sometimes referred to as "source" and "target" nodes). Just like nodes, relationships can have properties. Relationships are similar to an arc or an edge in a classical graph from Graph Theory.
Relationship type
Marks a relationship as a member of a named subset. A relationship must be assigned one and only one type.
Property
A property is a named value (a pair, consisting of a name and a value attached to that name) stored in a node or a relationship. Synonym for an attribute.
Edge
Synonym for relationship.
Graph path
Collection of alternating nodes and relationships that correspond to a walk in the graph.
Directed graph
A graph whose relationships (edges, arcs) have a designated start node and an end node.
Undirected graph
An undirected graph is a graph in which any two nodes connected by a relationship are equal, no start or end node is designated.
Graph database
A database that uses graph-based structures (for example, nodes, relationships, properties) to represent and store data. A graph database is a set of nodes, relationships between those nodes, and the attached labels, types, and properties.
What is a visualization
Graphlytic is used to analyze and visualize connected data (graph data). Graphlytic visualization is intended to be used as a canvas where users can place nodes from any supported graph database and interactively explore their relationships, create additional calculations, or modify data in the graph database. Data can be also manipulated automatically with data jobs running in the background (loading data from other sources, checking for patterns, sending notifications, etc.).
Visualization provides a set of easy-to-use tools for graph manipulation in order to highlight particular features of the graph. These features include intuitive data exploring (see clip below) and statistics, different automatic layouts, dynamic selections, shortest path finding, mapping data to the style properties like color or size, creating dynamic formulas in JavaScript to calculate new properties of the graph elements, and much more.

What is a Project
Project in Graphlytic represents a set of visualizations created from data from the same graph DB with the same set of project configurations.
Visualizations can be privately shared between users with access to the same project.
For more information please see Projects .